Where's my Voi scooter: [Conclusion] What I learned from Voi scooter data this summer
![Where's my Voi scooter: [Conclusion] What I learned from Voi scooter data this summer](/_next/image?url=https%3A%2F%2Fcdn.hashnode.com%2Fres%2Fhashnode%2Fimage%2Fupload%2Fv1663667231908%2FU1uWHWlH1.png&w=3840&q=75)
This blog post concludes what I learned from the data collected in the Where's my Voi scooter series. I started this study at the beginning of the summer aiming to find ways to locate a Voi scooter by collecting data on Voi scooters. I tracked the scooter location and the battery level of scooters in my city at one-minute intervals using the Application Program Interface (API) on their mobile app. Below is a summary of what I have learned from the study.
Mean battery level of scooters
Graph for the entire duration
This is the mean battery level of all scooters around the city during the entire duration of the project. The graphs may look small, you can right-click the image and click open image in new tab to enlarge them.
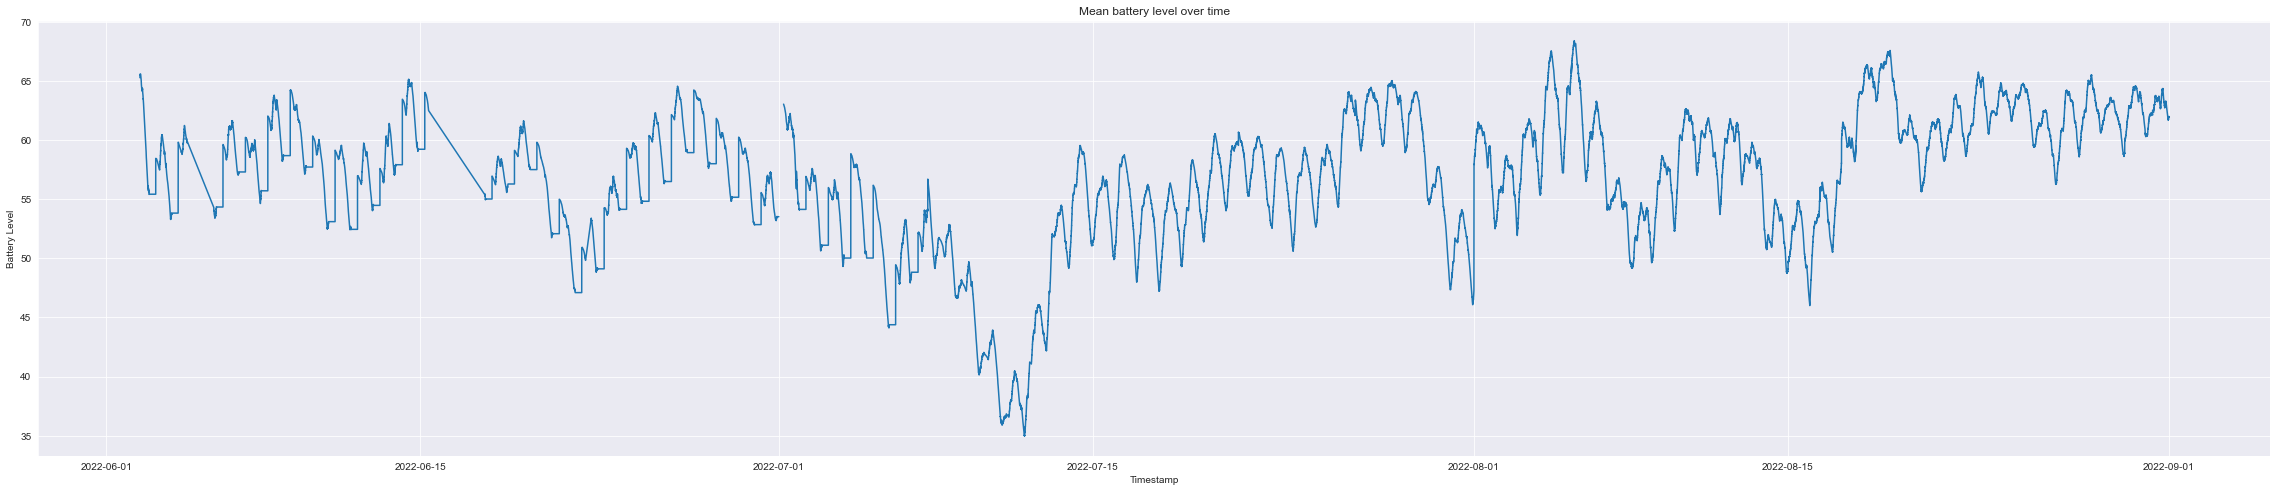
In general, the mean battery level fluctuated between 55% and 60%.
We can observe that before 7 July, there were flat lines every day. This was because back then scooters went offline at 10 pm, and online at 6 am. During that time my program could not collect data and it assumed the battery level didn't change. After 7 July, you can see that the transitions in the graph were smooth again with no jumps.
A scooter "goes offline" when the API no longer returns information about the scooter. The API that I used is the API that tells users where the idle scooters are. So when someone is using the scooter, when the battery of the scooter is being charged, or when the scooter is sent back to the warehouse, the scooter is considered "offline".
We can also see errors in the data collection. There were two sloped straight lines during June, as back then my program would crash if the API server didn’t return information. This was fixed afterwards by adding a try-catch and retrying after failures. The second error was on 1 July, the graph broke into half. This is because I calculated the mean battery level each month, and the program guesses the battery levels of offline scooters by forward filling, ie. if the scooter went offline with 70% battery, the program assumes it would stay at 70% while being offline. When the new month started, the scooters with unknown battery levels were not included in the calculation, so there was a jump in the value. The reason I used forward filling despite this disadvantage is given in the 7th blog in this series.
We can also see a sharp decline in battery levels around 7 July. This might be because scooters no longer went offline at night and the scooter service area was expanded, so the battery drained even during the night, and with a wider area, it was more difficult to reach them and replace the battery of them.
Graph for weeks
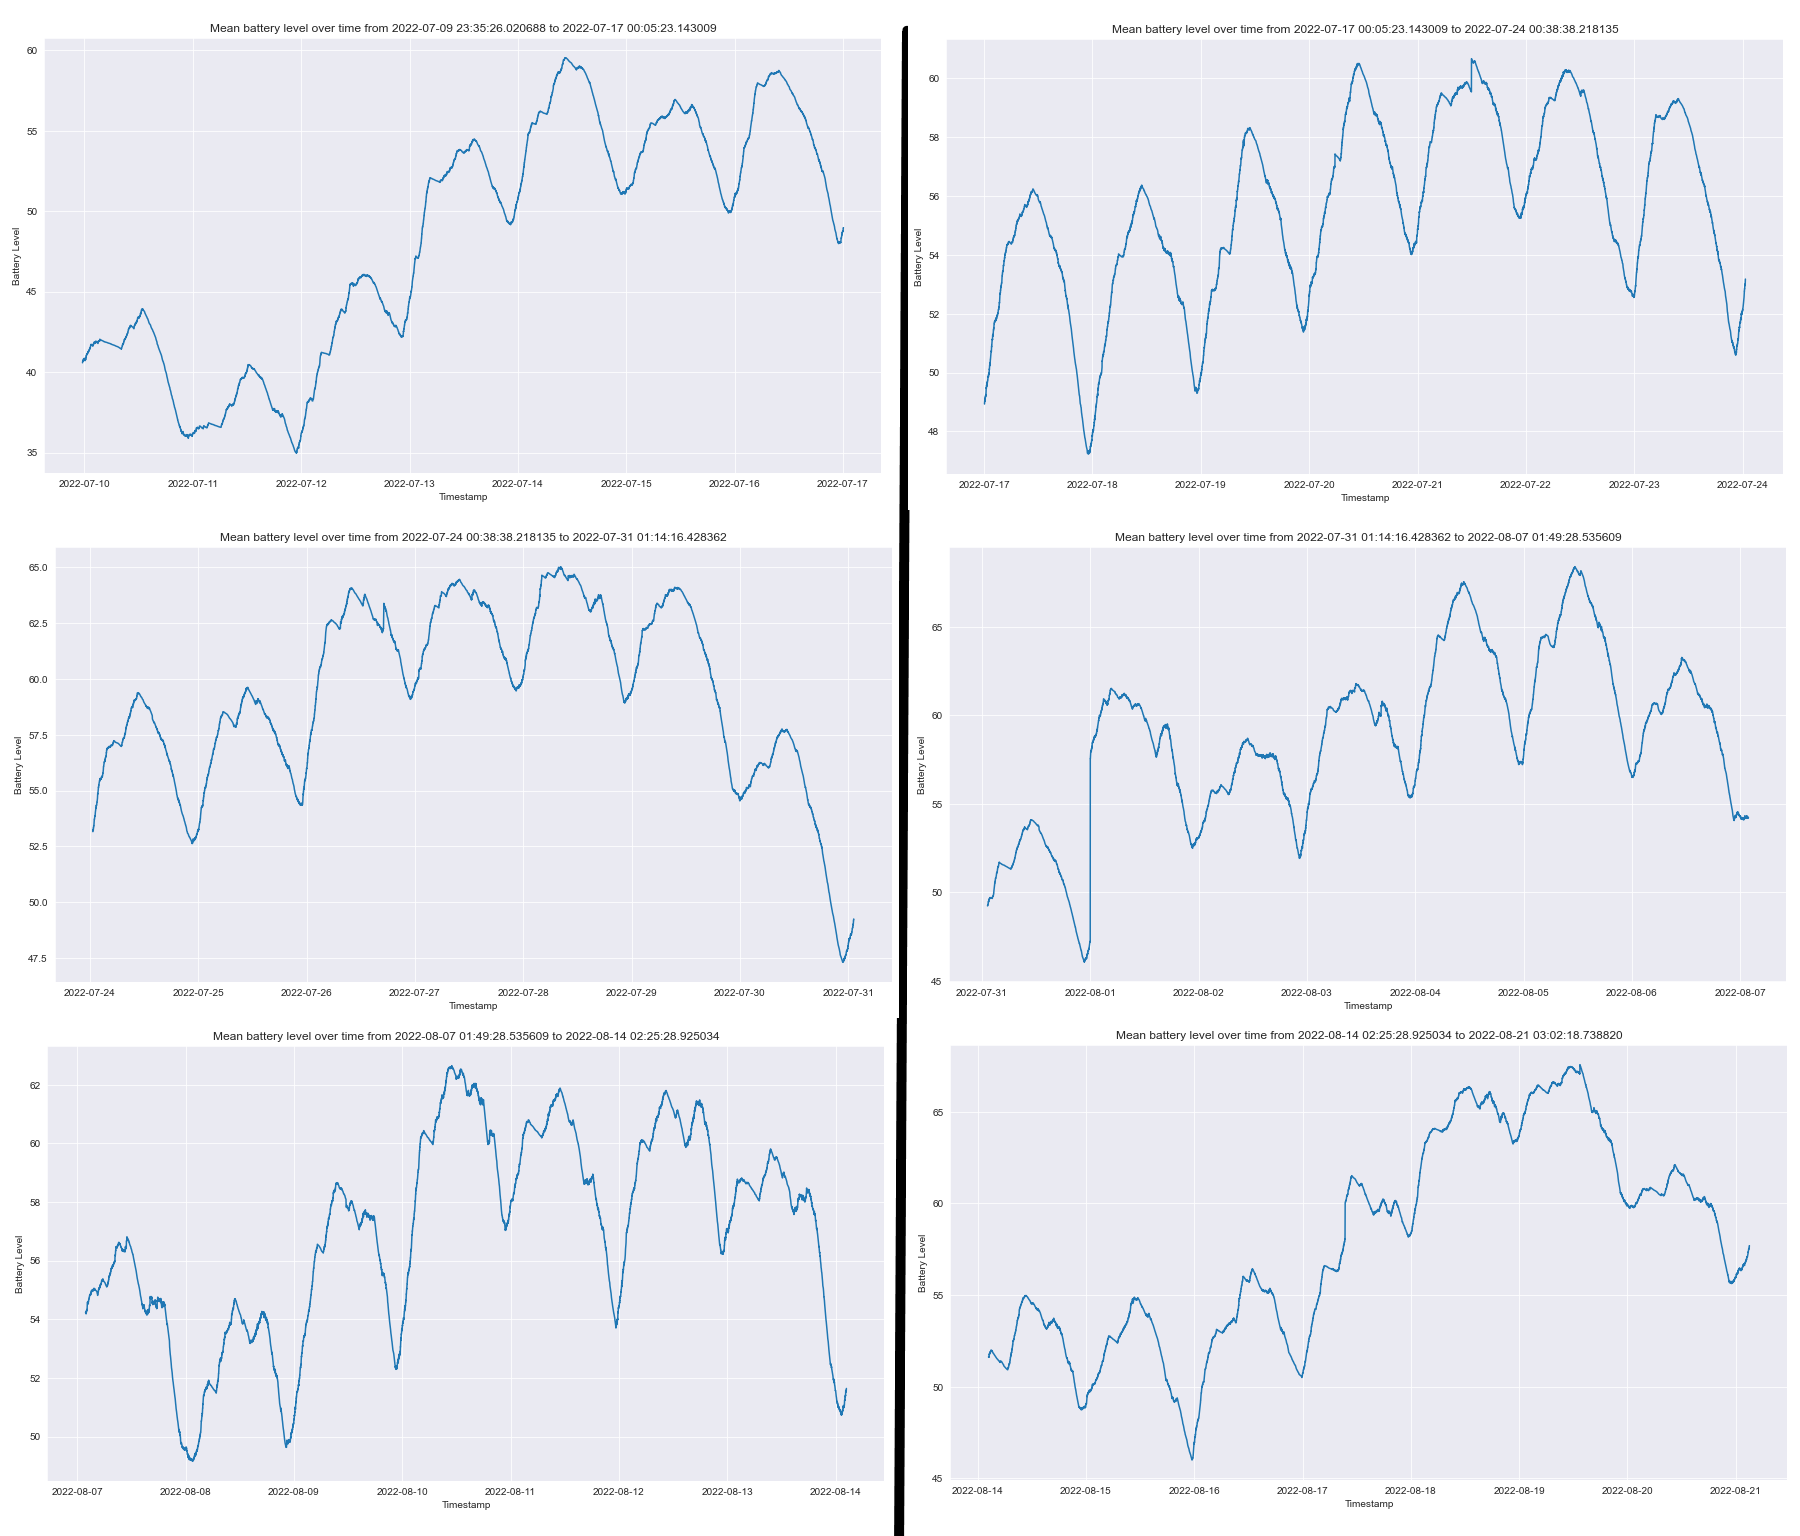
These graphs were weeks starting from 10 July, they all started on Sundays. There was a general trend that the battery level was higher in the second half of the week.
Graph for days
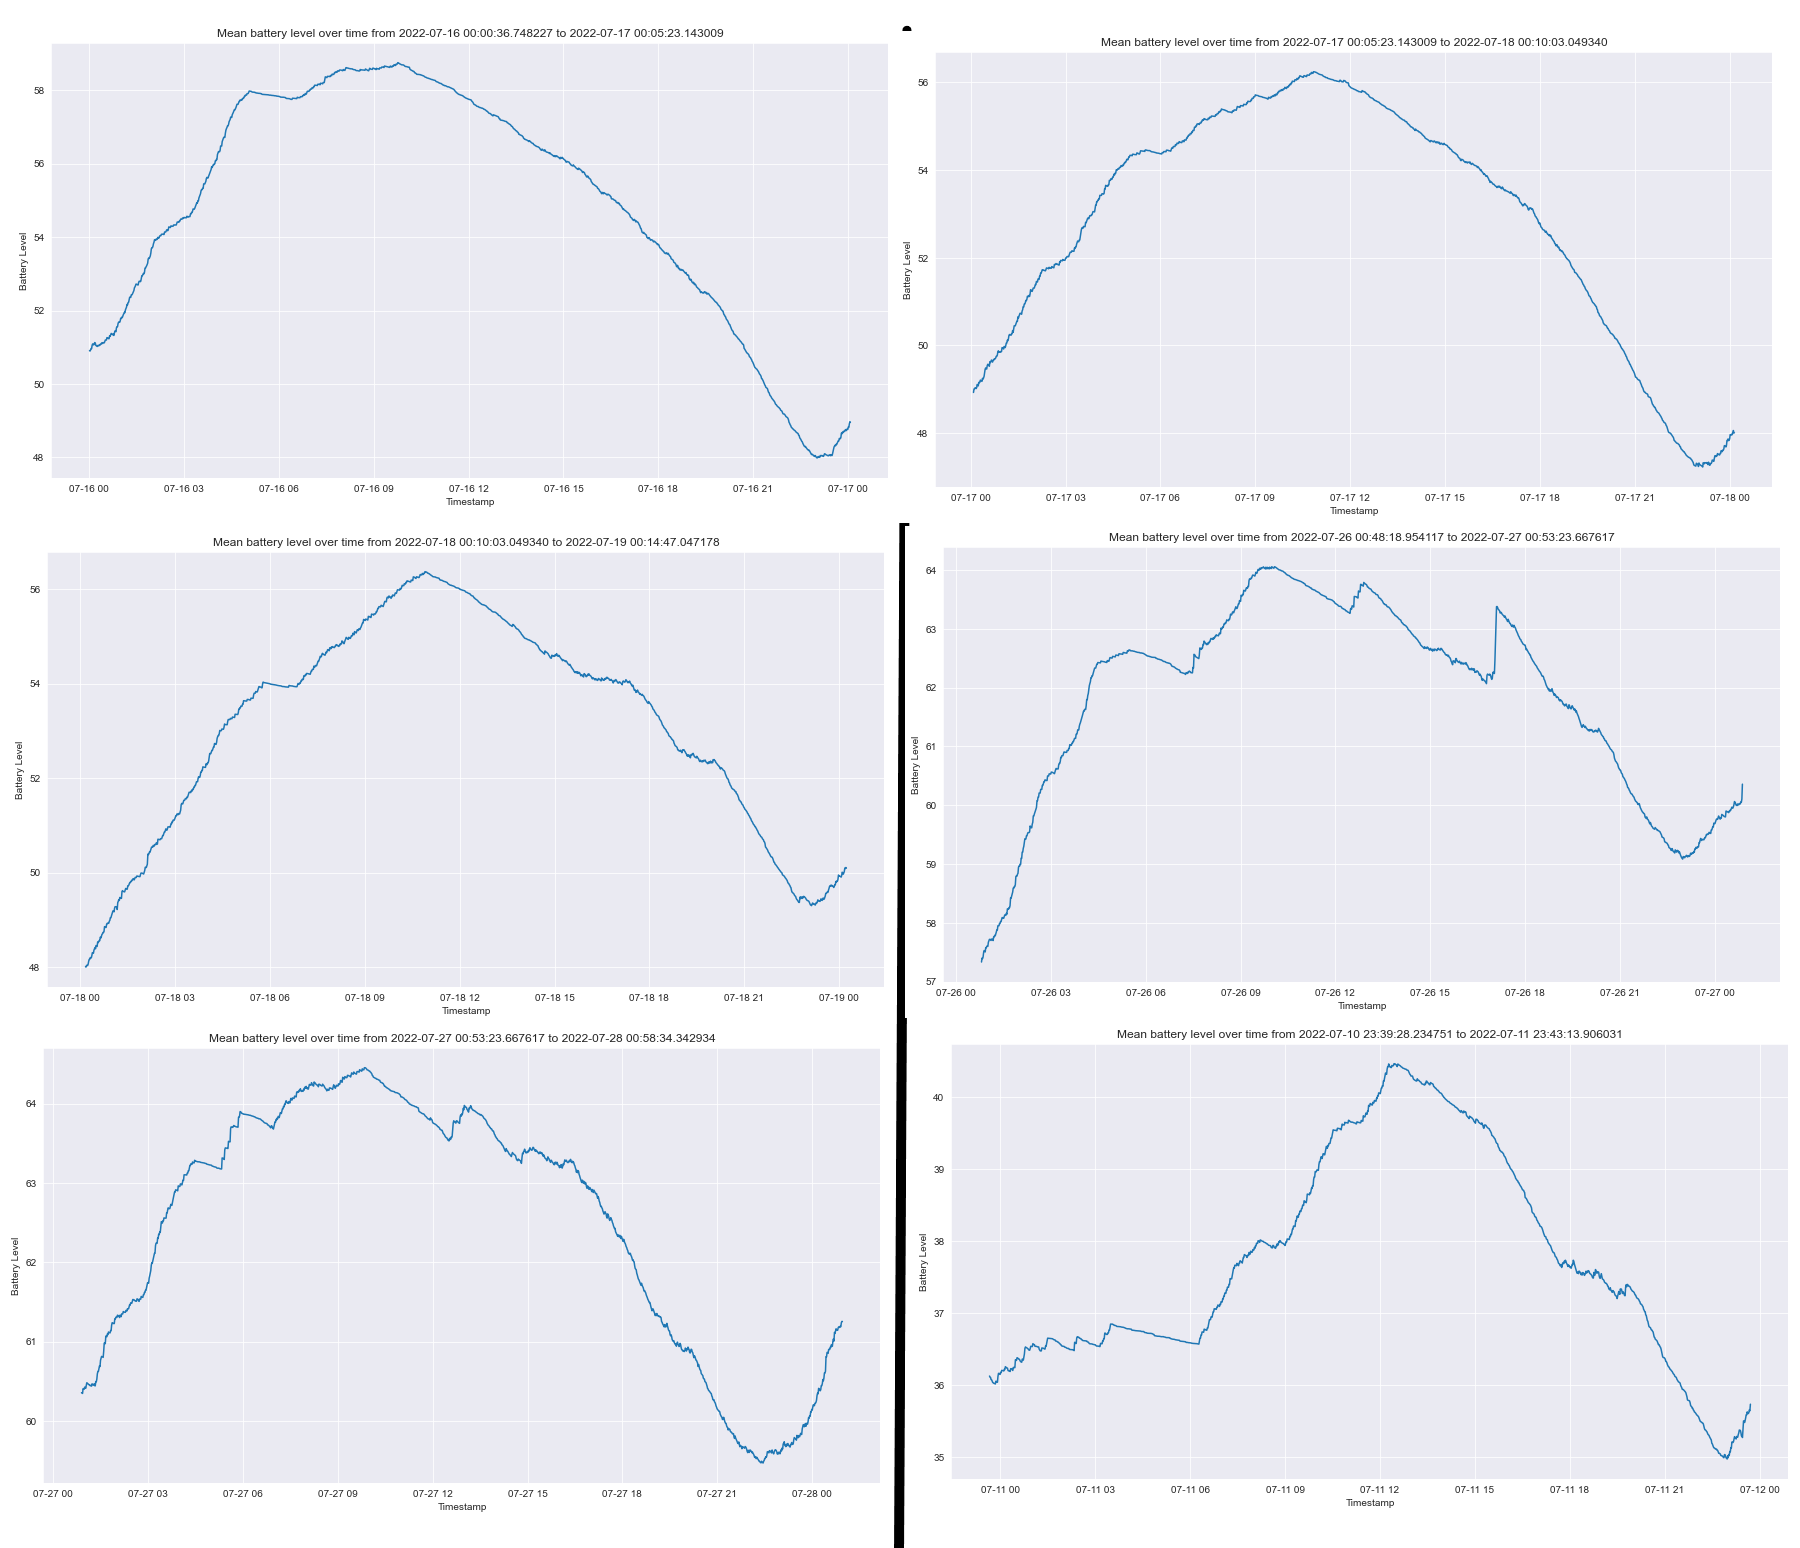
These graphs were some days, they all started at around 0 am. There was a general trend that the battery level would increase in the first half of the day, usually, at 10 am, then start decreasing. This was strange, an increase in battery level should mean someone was swapping out the batteries, or new scooters with a full battery was being introduced. But it was hard to imagine people swapping batteries in the middle of the night.
Available scooter count
Graph for the entire duration
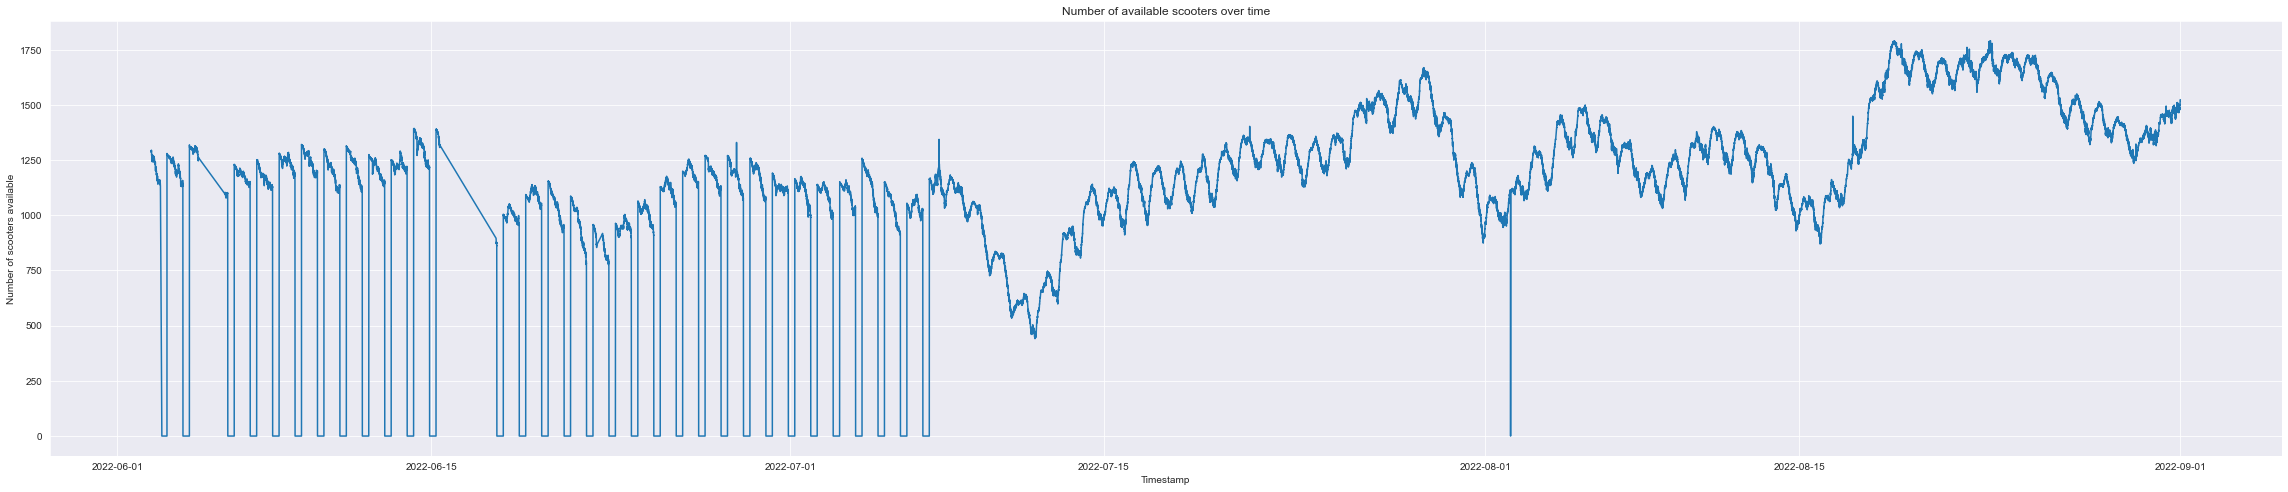
Same as the mean battery level, the days before 7 July had the count drop to zero at night because they were offline. And the number of available scooters also sharply declined from around 1150 scooters to under 500 scooters on 11 July. Presumably, it was because of the change in operation too.
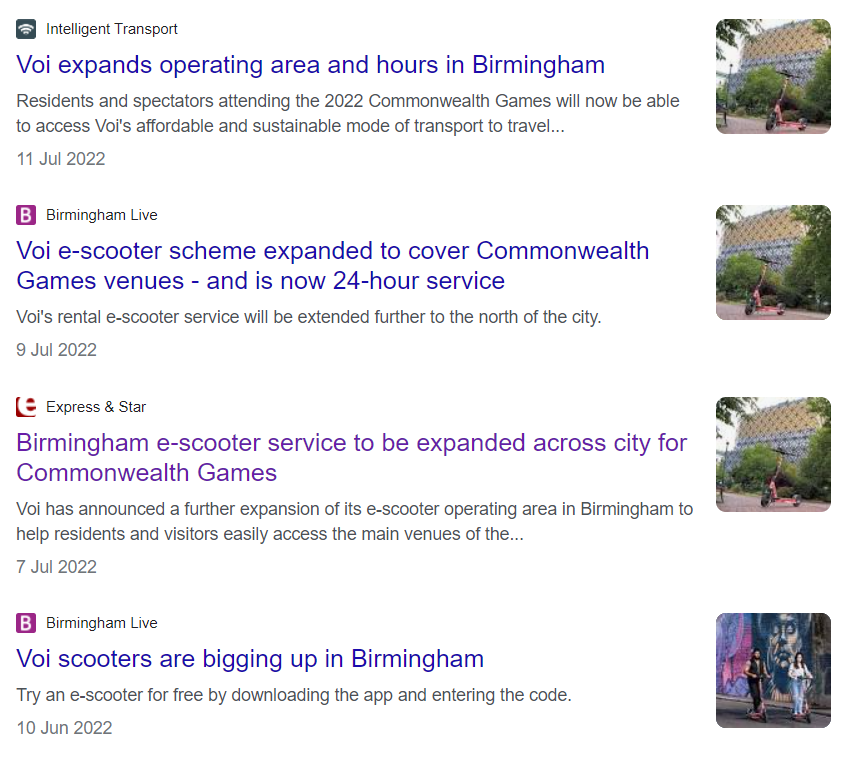
We can also observe that more scooters were put into operation from 26 July, I believed it was due to the Commonwealth Games 2022 on 28 Jul 2022 – 8 Aug 2022. When the Commonwealth Games started, the number of available scooters, along with the mean scooter battery level dropped. It should be because of the increased ridership. This can be confirmed on the news where it said Voi sees record e-scooter ridership during 2022 Commonwealth Games at over 66,000 journeys.
Then the count returned to normal until 16 Aug but the count increased again on 19 Aug when the number of scooters exceeded 1750 scooters.
Graph for weeks
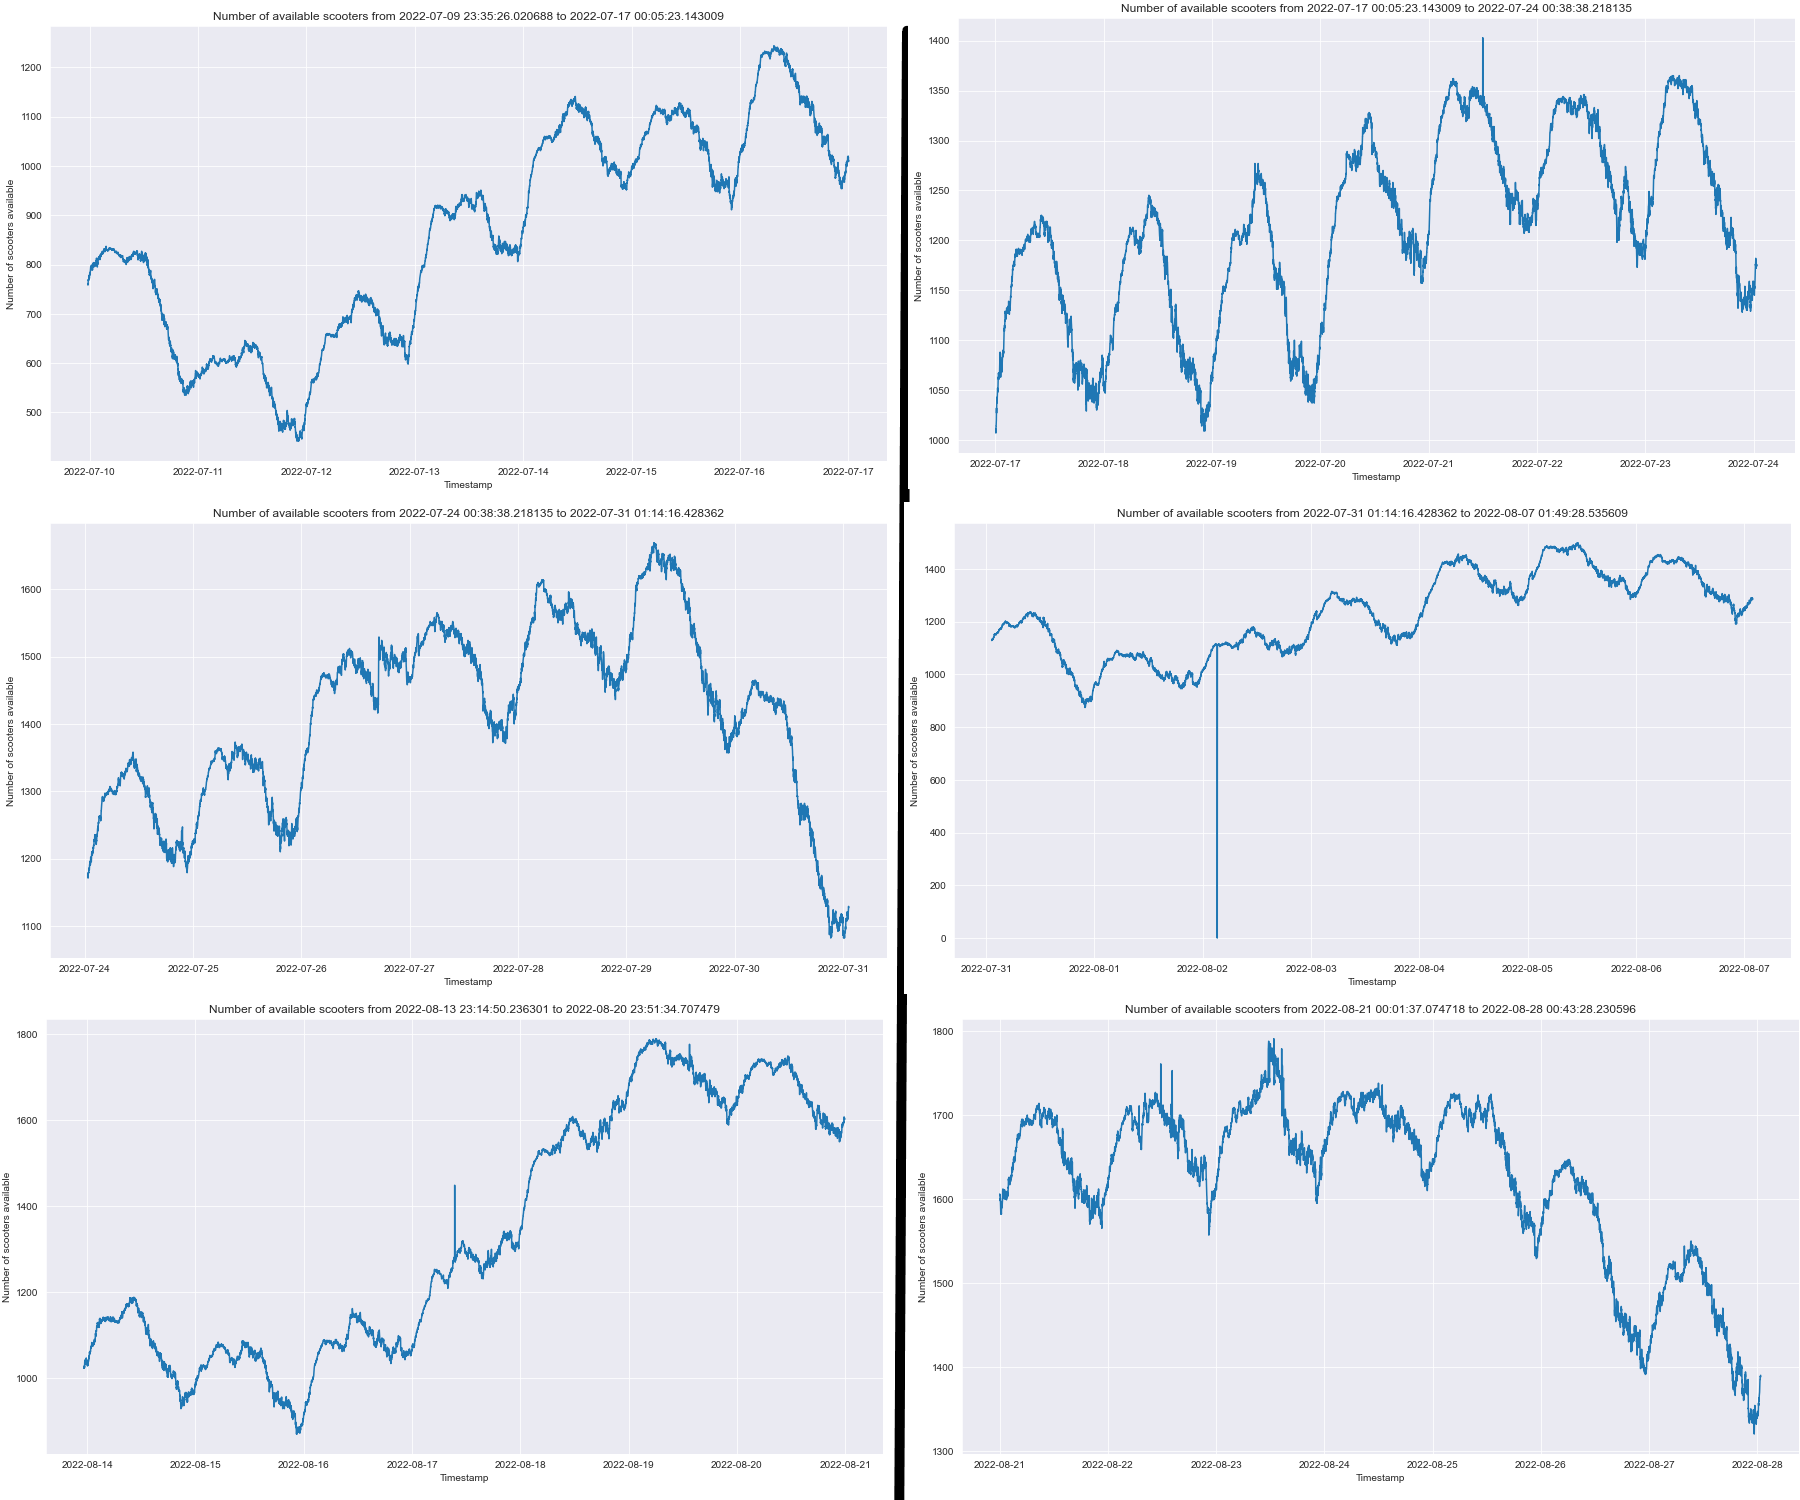
These are graphs of weeks starting from Sunday. There seemed to be a slight trend where the number of scooters in the second half of the week was higher.
Graph for days
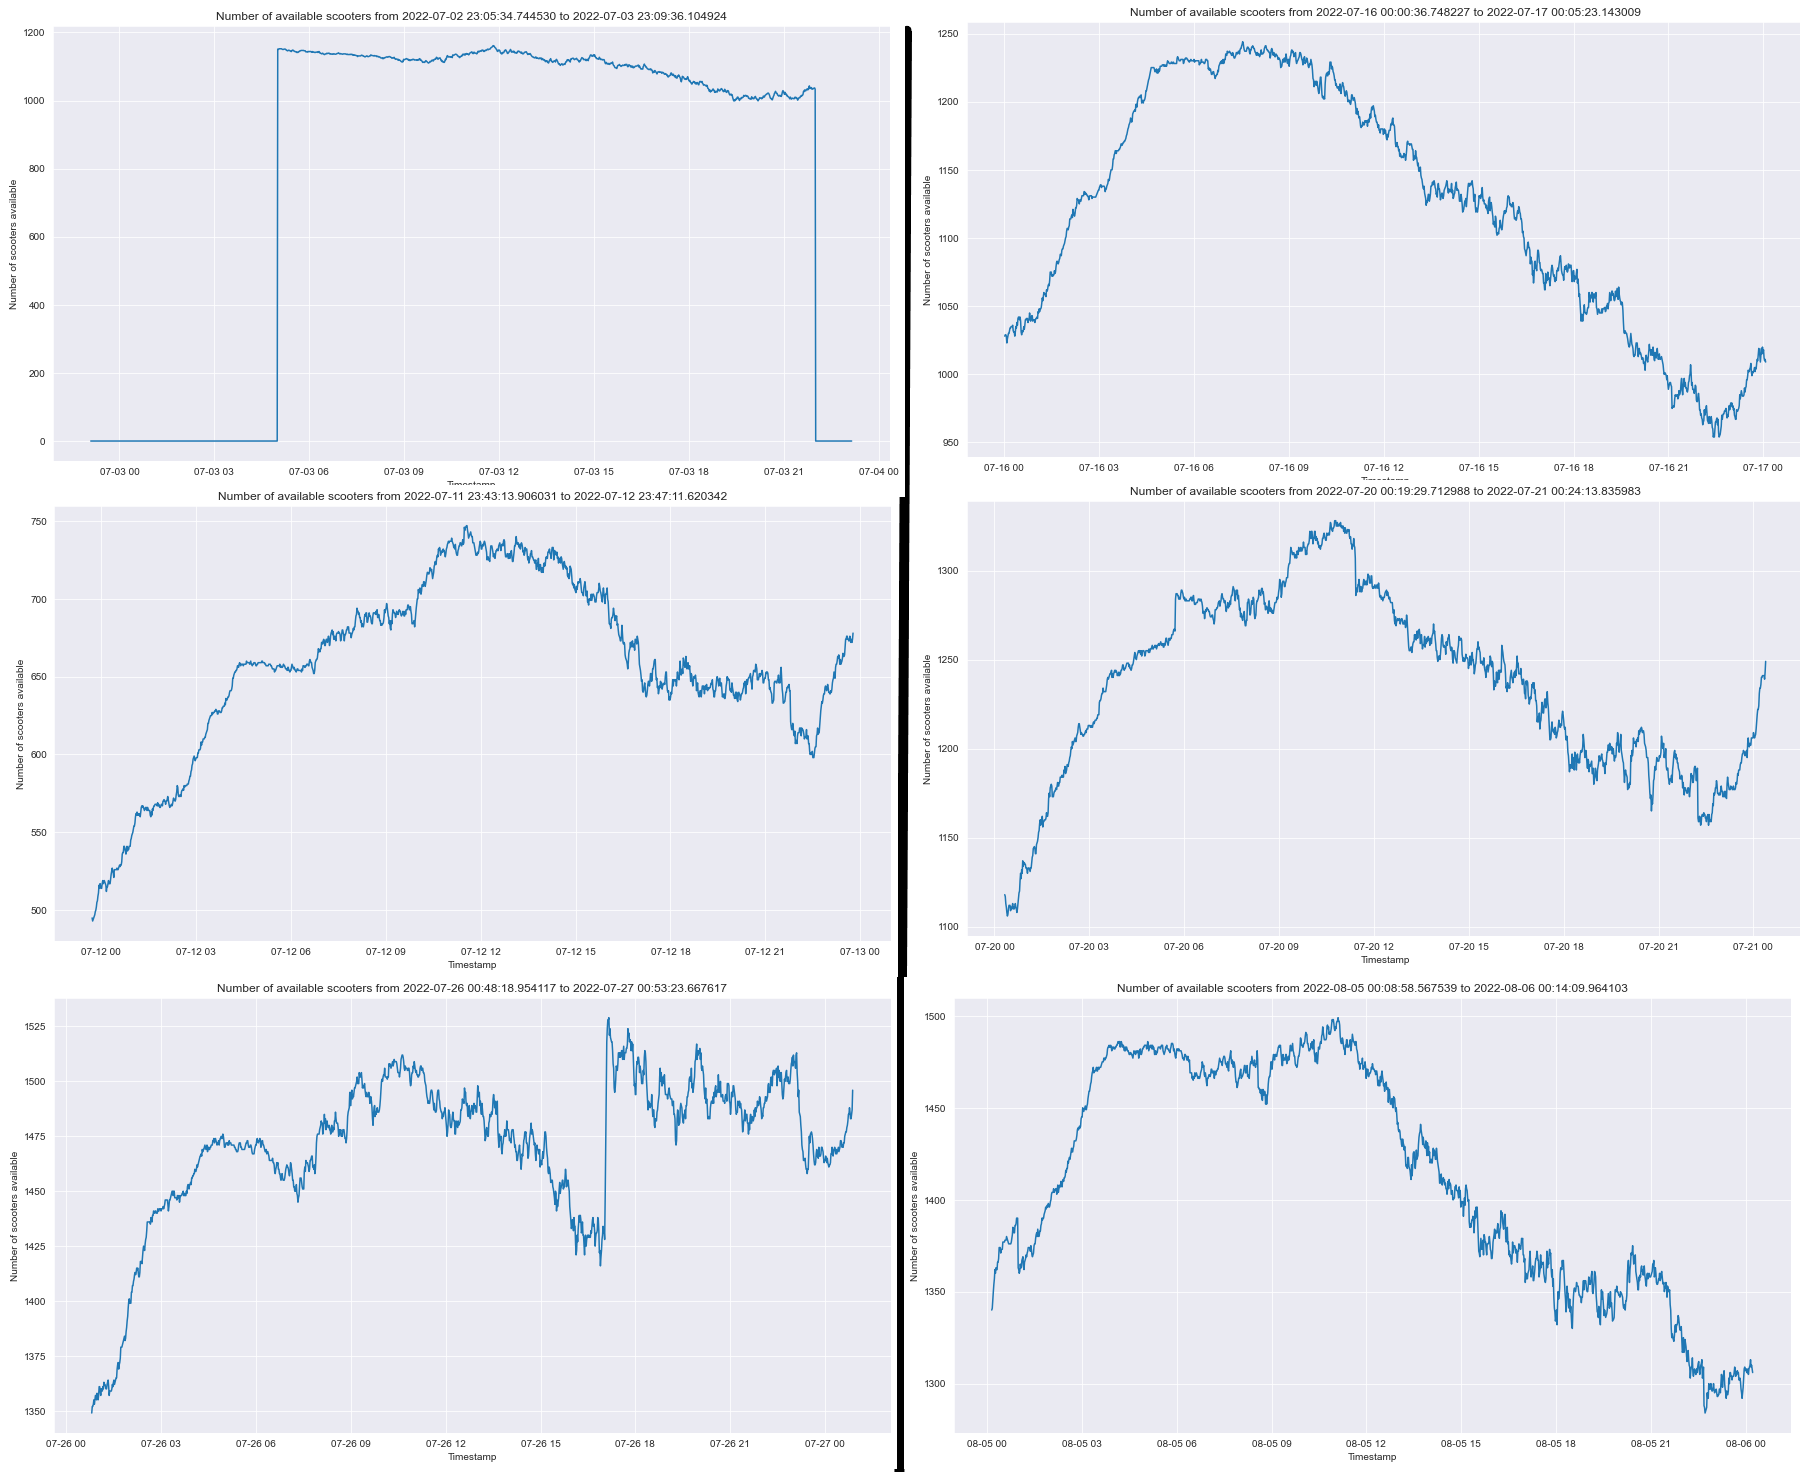
These are graphs of days starting at 0 am, usually, the number of scooters increases to about the middle of the day, then decreases.
Ridership
Total graph
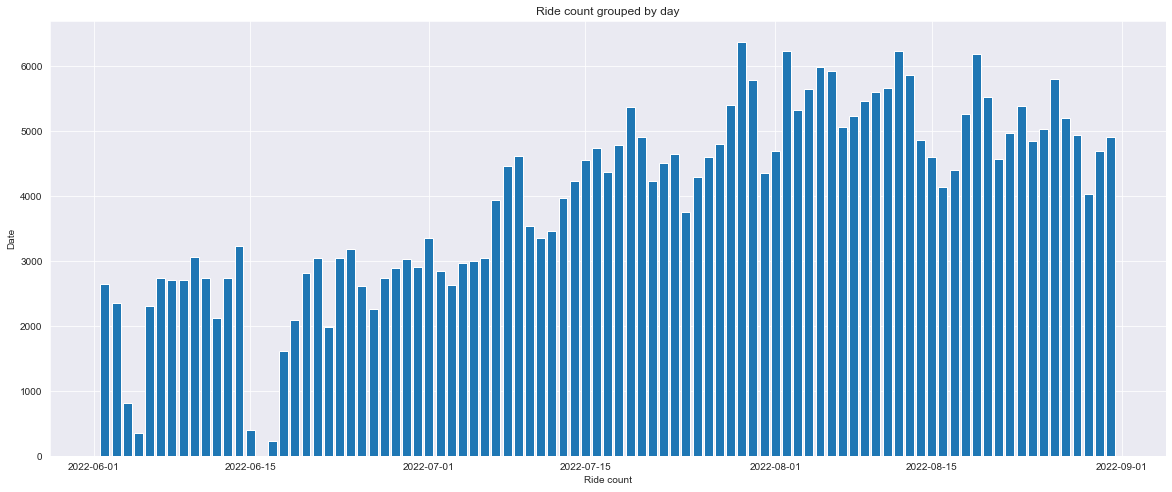
This graph corresponded positively to the available scooter count graph, when more scooters became available, more rides happened too. In July, there are fewer rides, but in July and August, the number of rides increased.
At the beginning of the graph, there were two places where the count hit close to zero, that was because of the error of my data collection program. My program crashed during that two times so I wasn't able to recognise rides during that two periods.
Commonwealth games
With this data, we can answer the question: did ridership increase during the Commonwealth Games 2022? The answer is it did. From 28 Jul 2022 to 8 Aug 2022, the ridership peaked at around 6400 rides per day, but the increase didn't stop there, it seemed even after the Commonwealth Games and the increase in scooter count and coverage, the increased ridership was maintained.
The sum of the rides during the Commonwealth Games calculated in my program is 65951, which was super close to 66000 said in this article. There was a discrepancy in the number due to the logic of my program. A ride was counted in my program when a scooter became offline and then online again within 45 minutes. But it did this at a one-minute interval. So if a rider parked a scooter and another rider rented it within a minute, my program would count it as one ride when there were supposed to be two. Another problem was that when a scooter temporarily went offline for a battery swap, my program still considered it a ride since the scooter went offline and then online.
I limited the maximum number of minutes in a ride because scooters might be taken to the warehouse, fixed, and re-released, so I could not count all instances of scooters being offline and then online again as a ride, so I chose 45 minutes as it was the maximum riding duration for a Voi pass.
Per week
Now I want to answer the question, does the ridership correspond with weekdays?
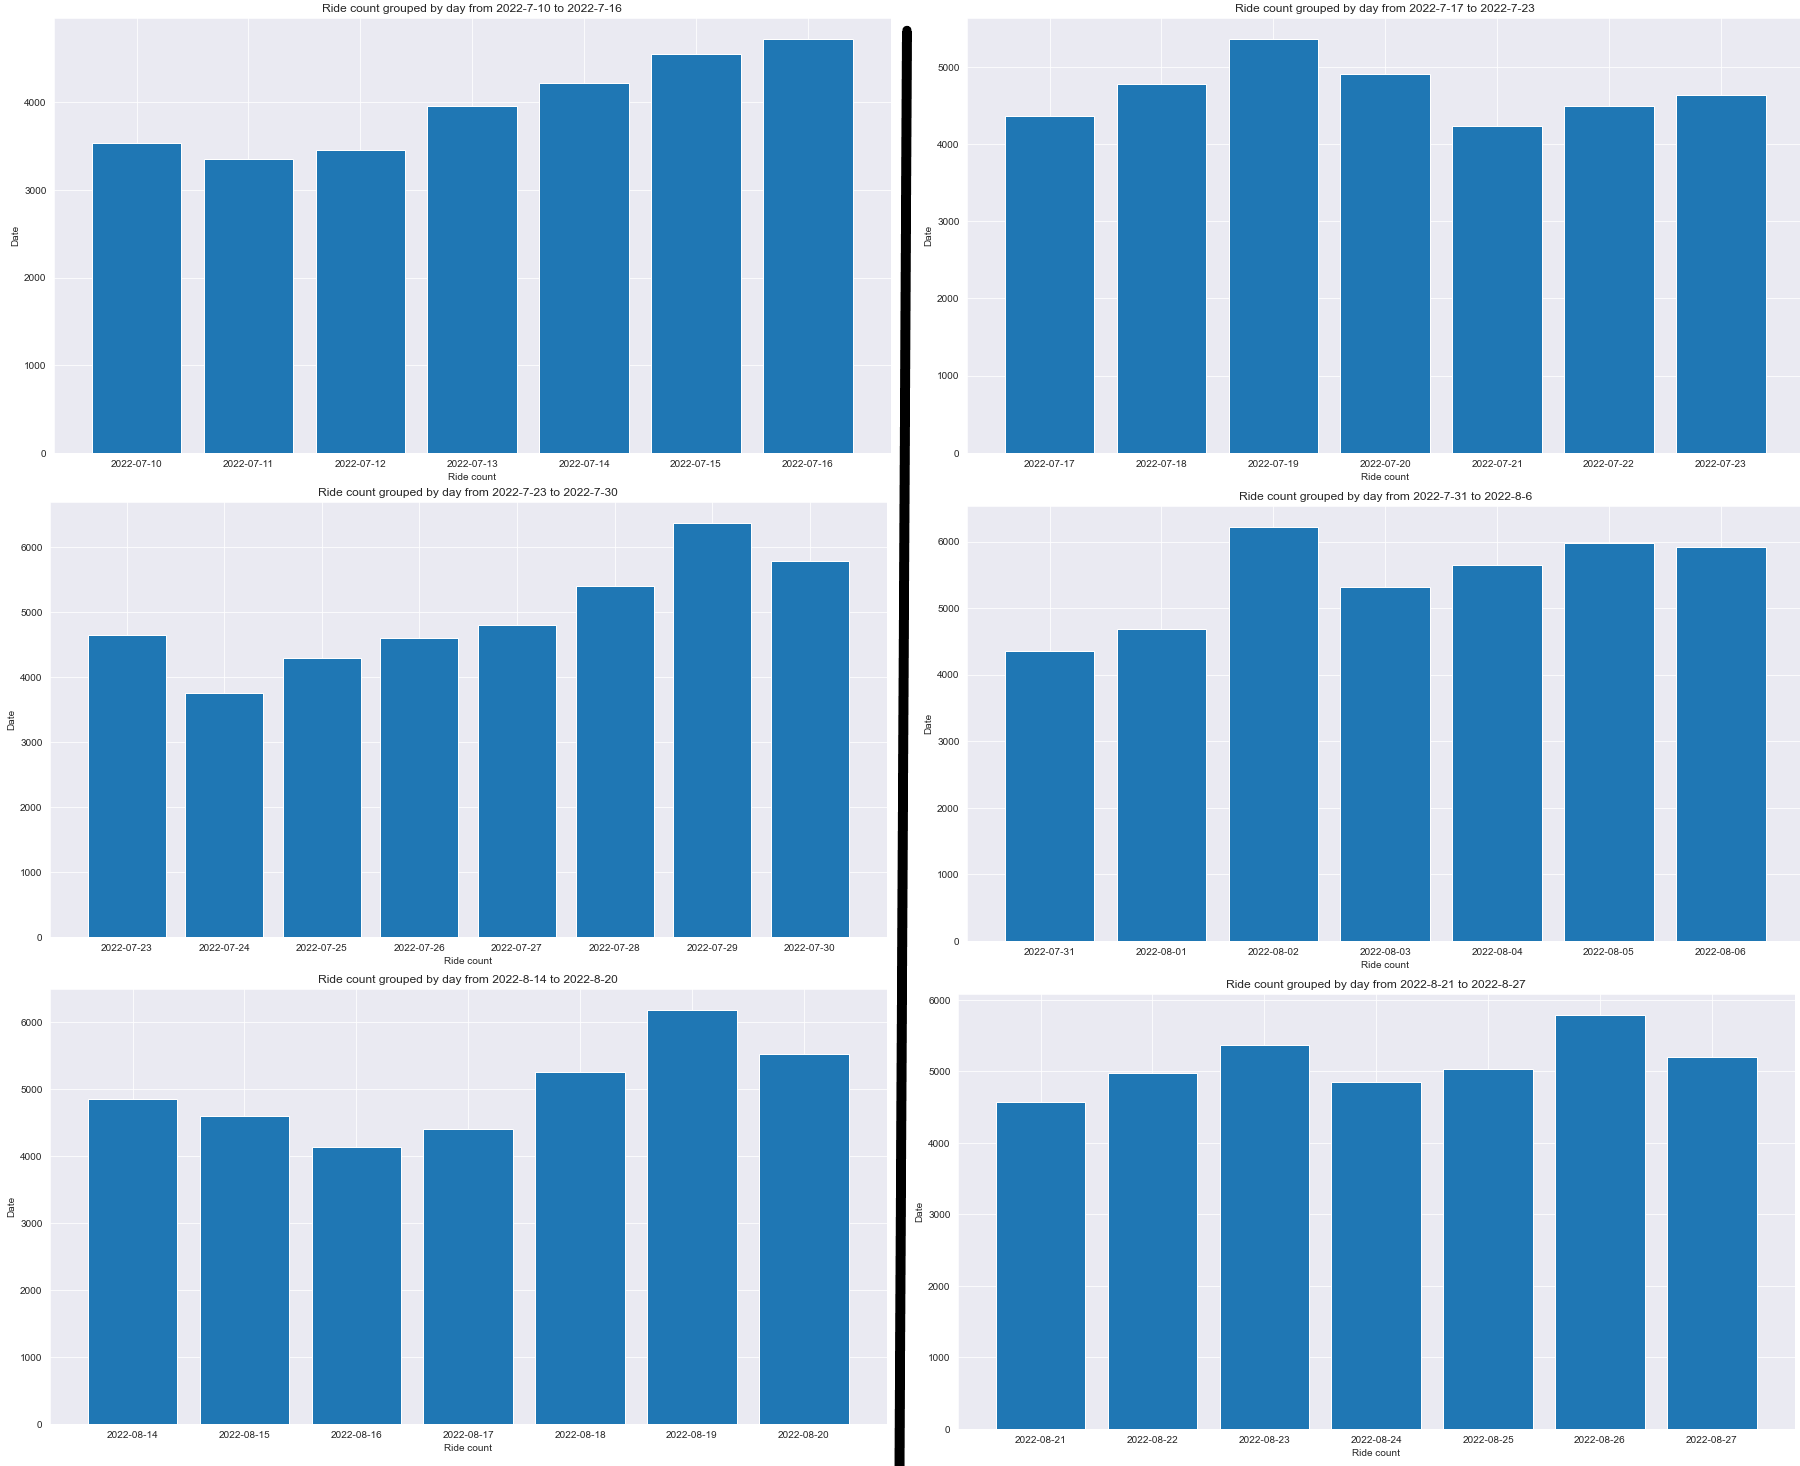
These weeks were the same as the ones with available scooter count. They generally corresponded with each other, days with more available scooters generally result in more ridership. There was no clear pattern in which weekdays had greater ridership.
Per day
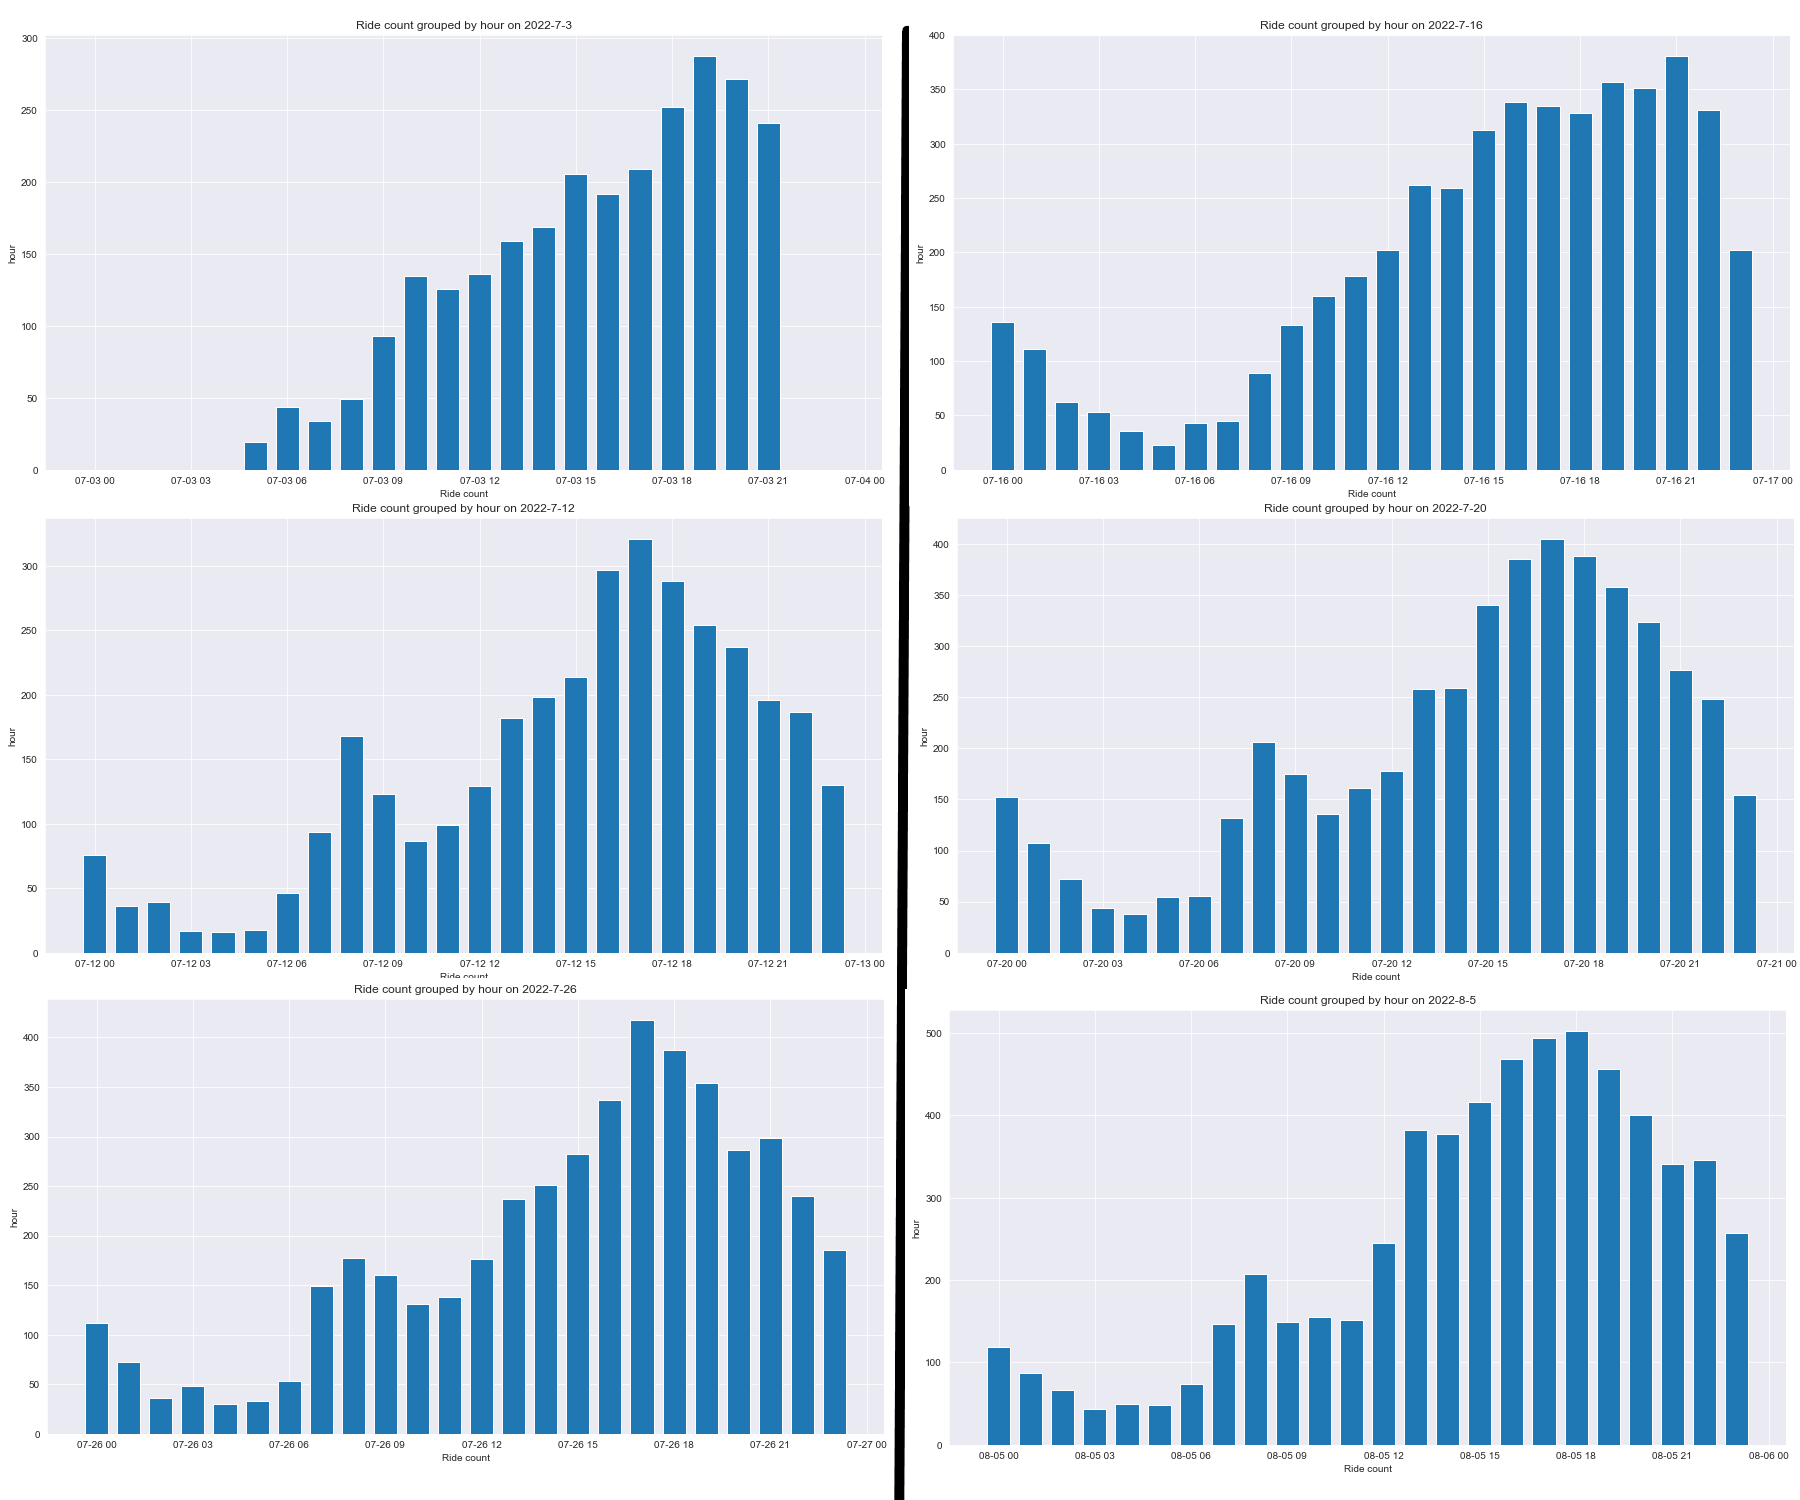
The same days were chosen as the ones in the available scooter count graphs. These graphs were generally the opposite of those graphs, the times with the least available scooter were the times with most rides, which makes sense because people were using scooters so there are fewer of them available.
We can also see on most days the ride count was minimum in the morning around 5 am, then increased to peak at 8 am, then fell back again, then increased again from 12 pm to around 8 pm, then slowly decreased. I think the first peak was when people get to work, and the second peak was for people leaving work.
Heatmap
day
I figured it made little sense to measure this over weeks or the entire period, so I decided to only measure this over a day.

The scooters generally became more concentrated on certain spots on the map from 0 to 12 pm, then became more spread out after that.
Battery consumption
During ride
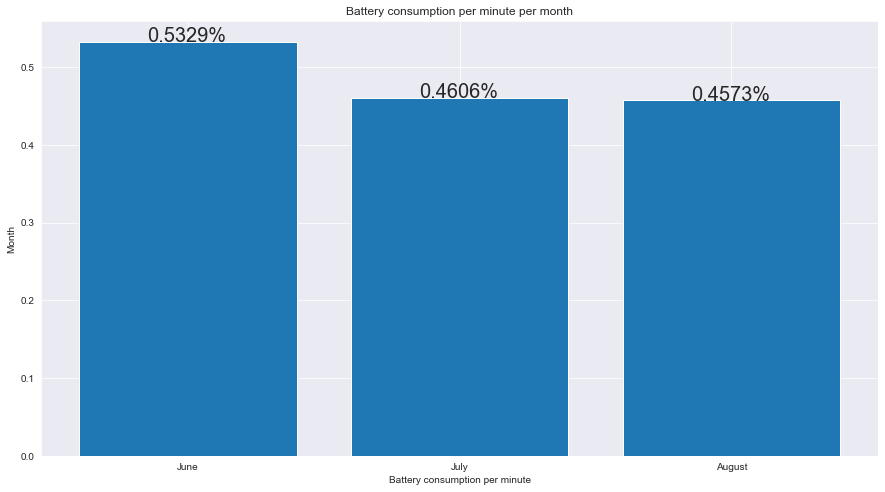
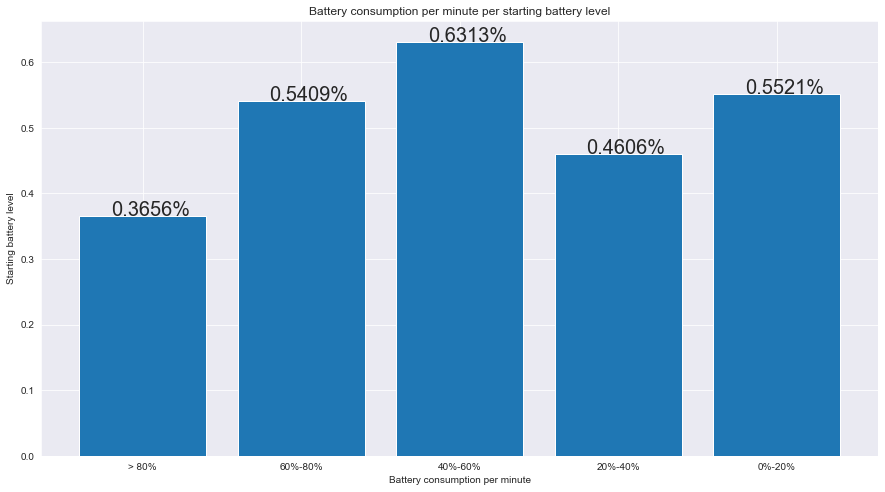
The way I calculated this was the same as ridership, so this analysis suffered from the same problems. However, I think these results would still be very close to the true value, as the calculation only fails in a few edge cases. The average level of battery drop was 0.461% per minute when unlocked. The battery consumption varied in each ride since scooters could be idle while unlocked, or be used in battery-consuming activities such as going up slopes.
I also filtered the battery consumption based on which month the data was collected, and found a surprising result. The battery consumption was decreasing. This is strange since I was taking on average all rides, so there shouldn't be much difference. Some possible explanation for this phenomenon was a change in rider behaviour, a change in battery capacity, or Voi figuring out a way to use less battery on its scooters.
I also filtered the results based on the starting battery level, and there are some interesting observations too. The results for the first half make sense, it is the same for our phones, the battery generally drains slower at a higher battery level. However, the battery drain decreased when it is below 40%, which is strange, usually, the battery drains the quickest when it is closest to zero.
When idle
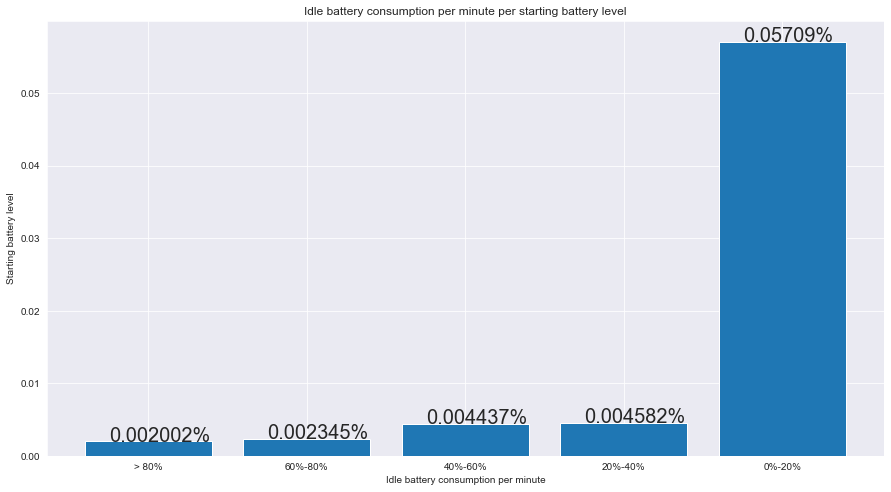
I also wanted to know what is the battery draining speed when the scooter is sitting there idle. The average battery drained, while the scooter was idle, was 0.006830% per minute.
Starting at different battery levels, the draining speed was different too, the less battery there was, the faster the battery drains, this was what I had expected.
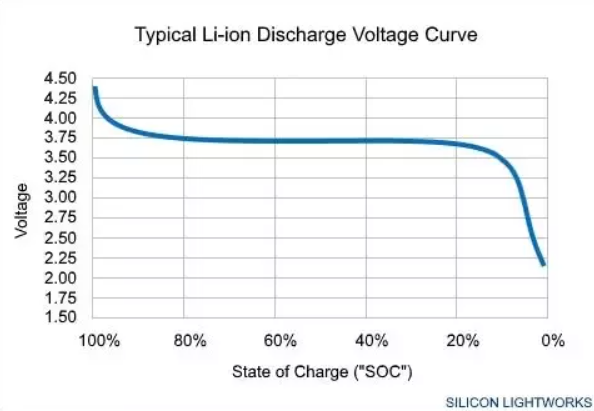
In my experience, lithium batteries, used in smartphones, usually drain faster when the battery level is lower. I wasn't able to pin down why, but I saw some explanations on the internet what I would like to share, one has to do with the lithium discharge voltage curve, in a lower stage of charge the voltage decreases and therefore the current has to be increased to maintain the power output, therefore the battery drains quicker. But I wasn't able to find solid proof of this, so if you know more, please let me know in the comments down below.
This brings us to another question, why during rides, the battery drained on 0-20% wasn’t the quickest, but during idle, the battery drained on 0-20% was the quickest? It could be an error in my data processing. It could also be that Voi's display battery level was not the actual battery level, it displayed a lower level when the battery was near zero so that it could travel further during the supposed near zero battery, to prevent the scooter from running out of battery mid-ride, but this is just a theory.
Conclusion
This project started out with the goal of locating a scooter in the city, which I am now able to do with the data I collected. But I found greater interest in studying the broader trend of scooters around my city. So below are my findings:
I can conclude that the scooter business is doing well. The ridership increased during the Commonwealth Games 2022 and the usage didn't drop back down after the games. The batteries are being replaced in time so their mean battery level and available scooter count are stable. The scooter's battery drain when idle is about 65 times slower than when on a ride, so leaving scooters on the street isn't costing them a lot.
Other than what I learned from the data, I also learned a lot about data analysis in the project, like how to collect and organize data, how to analyse them, and some handy Python modules to make it easier.
![Focuster review: My experience as a student in summer [week 3]](/_next/image?url=https%3A%2F%2Fcdn.hashnode.com%2Fres%2Fhashnode%2Fimage%2Fupload%2Fv1693222238382%2F06452c01-14a3-423a-9311-83b9d82f6fcc.png&w=3840&q=75)
![Reclaim.AI review: My experience as a student in internship [week 2]](/_next/image?url=https%3A%2F%2Fcdn.hashnode.com%2Fres%2Fhashnode%2Fimage%2Fupload%2Fv1692385558997%2F5cd2253e-b50d-4d47-9aad-72807848b1a9.png&w=3840&q=75)
![Motion Review: My experience as a student in internship [week 1]](/_next/image?url=https%3A%2F%2Fcdn.hashnode.com%2Fres%2Fhashnode%2Fimage%2Fupload%2Fv1690840123756%2F5bdf844a-d728-430c-8d9b-b88b7b77c726.png&w=3840&q=75)
![Trialling Productivity Tools to Rescue My Time [Week 0]](/_next/image?url=https%3A%2F%2Fcdn.hashnode.com%2Fres%2Fhashnode%2Fimage%2Fupload%2Fv1690321356599%2F2f404dbe-3c2a-421b-903c-04d72c8febed.png&w=3840&q=75)