Where's my Voi scooter: [6] Changing the data storage format
![Where's my Voi scooter: [6] Changing the data storage format](/_next/image?url=https%3A%2F%2Fcdn.hashnode.com%2Fres%2Fhashnode%2Fimage%2Funsplash%2FWpnoqo2plFA%2Fupload%2Fv1657202339643%2F4zyHEDEve.jpeg&w=3840&q=75)
In this blog post I will first fix the data collection program, and then change how the data is stored, to facilitate further analysis.
Improving the data collection program
The data collection program crashed multiple times. Since data cannot be collected while the program is crashed, I have a lot of missing data, which makes data analysis difficult.
I need a try-except block to catch exceptions instead of letting the program crash. I should have done this long ago, but I was lazy. Now I need to pay the price.
In the main loop, I first ask for a response, then store the response, and wait 60 seconds before making another request, the two possible errors are:
Failing to get a response from the server
When I make a request to the API server, it has happened that it refuses to give me an access token, or response. In this case, I need to cancel future actions and make a request maybe 5 seconds later.
Getting an invalid response from the server
If the response is not what I expected, I will simply not parse the response. and wait for the next iteration.
The fix of the data collection program
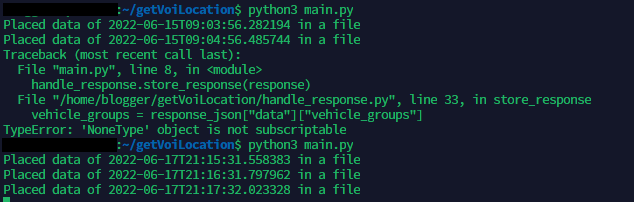
The following is the before and after of the main loop. I used two try-except blocks to wrap up the two functions that may crash. In the first block, if the program runs into an exception, I will print out what is the problem, and continue the loop after 5 seconds. In the second block, I simply print out the problem and do nothing. So now if something bad happens, the program will not crash, but instead, wait and try again later. In retrospect, this fix is so easy that I should have done this earlier, so then I don't have to deal with so much missing data.
Before:
while True:
    response = make_api_requests.get_scooter_locations()
    handle_response.store_response(response)
    time.sleep(60)
After:
while True:
    try:
        response = make_api_requests.get_scooter_locations()
    except:
        print("Failed to get scooter locations, retrying in 5 seconds")
        time.sleep(5)
        continue
    try:
        handle_response.store_response(response)
    except:
        print("Failed to store response, will skip storing the response")
    time.sleep(60)
Moving the project to a Jupyter notebook
From my other blog post, I discovered about Jupyter notebook and decided to use it to complete the analysis. As a JetBrains user, I searched for tools from Jetbrains that support Jupyter notebooks. I found DataSpell. It seems useful for me as it can:
- automatically starts a Jupiter server when I start running the code
- allow me to view dataframes and Jupyter notebook variables
- be used for free because of the Github Student Developer plan, so why not
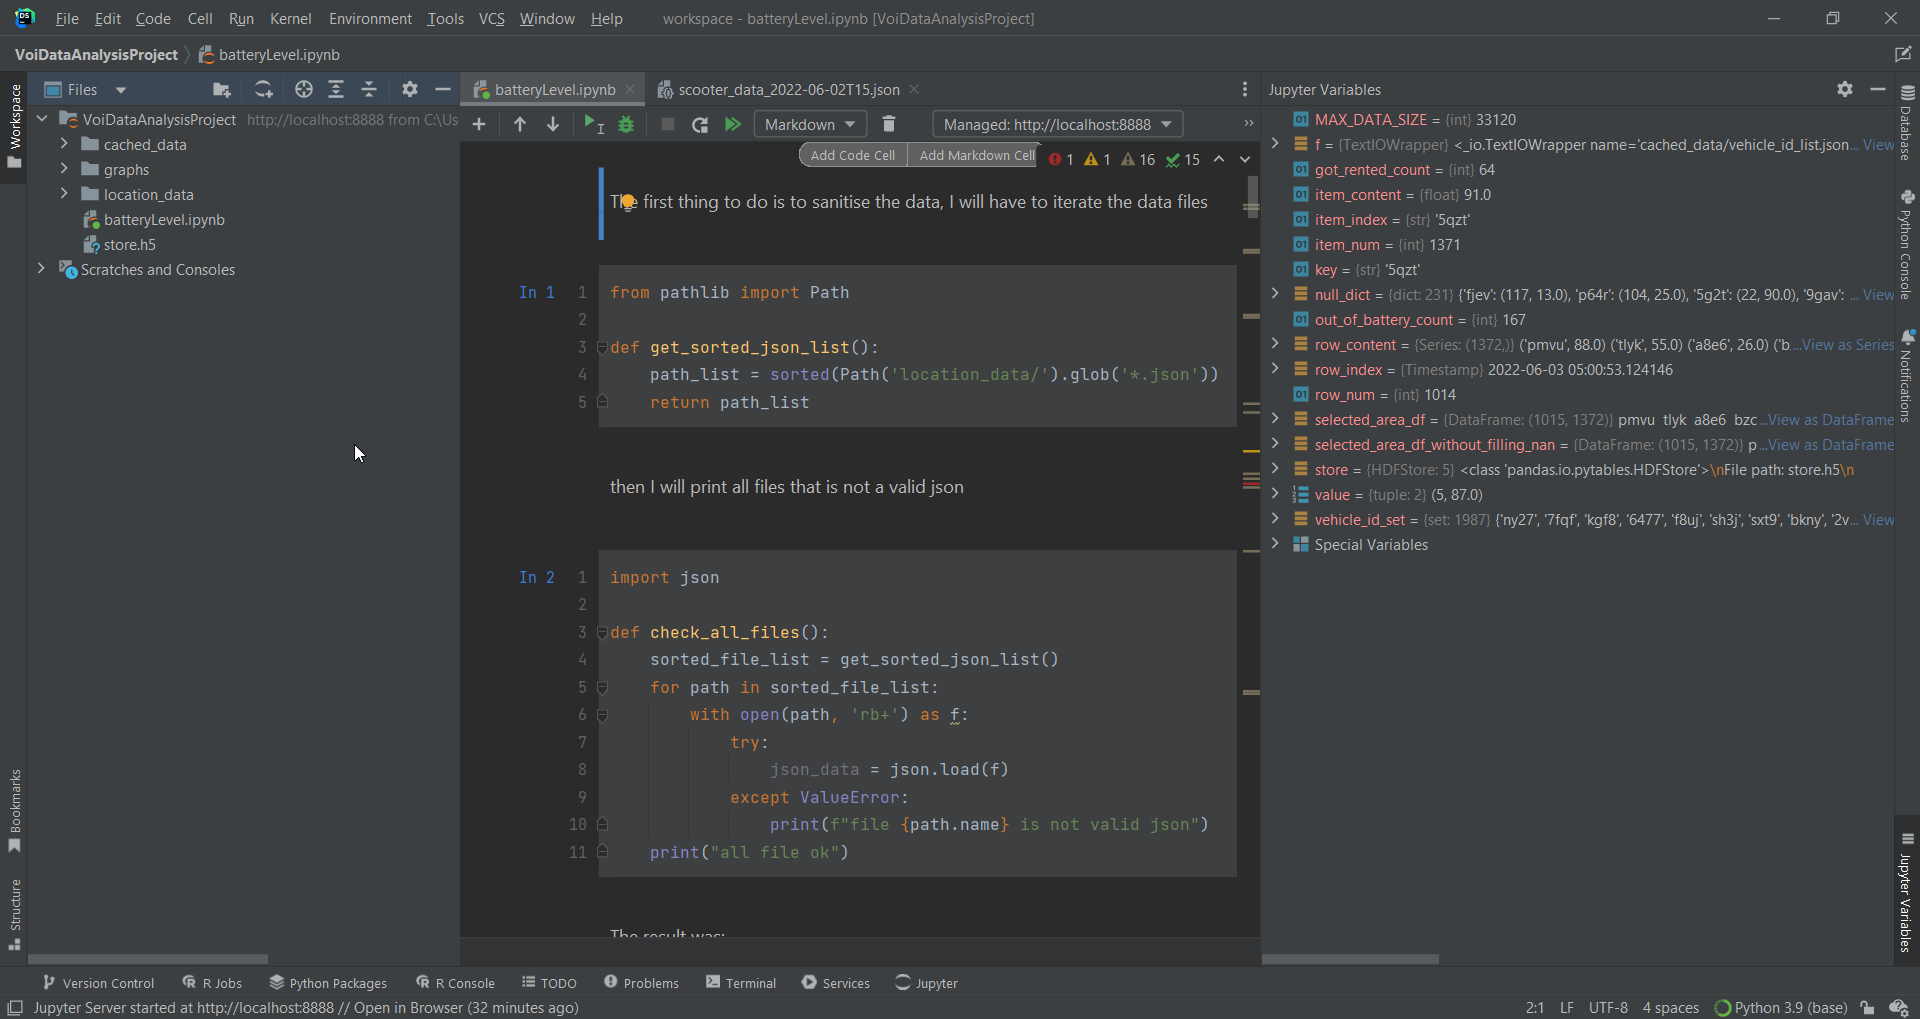
Importing and checking data
The first thing to do is to sanitise the data, I will have to iterate the data files. I copied the functions from my previous blog post.
from pathlib import Path

def get_sorted_json_list():
    path_list = sorted(Path('location_data/').glob('*.json'))
    return path_list
Then I print all files that are not valid json, because if my data-gathering program ran correctly, all data should be valid json, so I want to double-check before doing any analysis.
import json

def check_all_files():
    sorted_file_list = get_sorted_json_list()
    for path in sorted_file_list:
        with open(path, 'rb+') as f:
            try:
                json_data = json.load(f)
            except ValueError:
                print(f"file {path.name} is not valid json")
    print("all file ok")
Two files showed up as invalid json, so I fixed the file and tried again, this time all are valid
Creating numpy array
In the previous blog post in this series, I plotted the graph of vehicle counts, now I want to redo it with the new data I gathered. I first created the numpy array for timestamps and vehicle counts.
import numpy as np
import pandas as pd

timestamp_np_array = np.empty(MAX_DATA_SIZE, dtype=pd.Timestamp)
vehicle_count_np_array = np.empty(MAX_DATA_SIZE, dtype=int)
counter = 0
Then I define the function that gets the vehicle count from a file, it opens the file and fills the two numpy arrays with data. I used the global keyword here so that I don't have to worry about scopes.
import traceback

def get_vehicle_count_list_from_file(path):
    global timestamp_np_array, vehicle_count_np_array, counter
    with open(path, 'r') as f:
        try:
            json_data = json.load(f)
            for individual_data in json_data:
                if counter < MAX_DATA_SIZE:
                    timestamp_np_array[counter] = pd.to_datetime(individual_data['time_stamp'])
                    vehicle_count_np_array[counter] = individual_data['vehicle_count']
                    counter += 1

        except ValueError:
            traceback.print_exc()
            print(f"file {path.name} is not valid json")
Then I execute the operation, truncate the two numpy arrays so they are only as long as the amount of data we have, and then save them so they can be loaded at another time, I am not going to work non-stop on this project, so I need to be able to load the data at another time.
for path in get_sorted_json_list():
    get_vehicle_count_list_from_file(path)

timestamp_np_array = timestamp_np_array[:counter]
vehicle_count_np_array = vehicle_count_np_array[:counter]

print(counter)

np.save('cached_data/timestamp_np_array', timestamp_np_array)
np.save('cached_data/vehicle_count_np_array', vehicle_count_np_array)
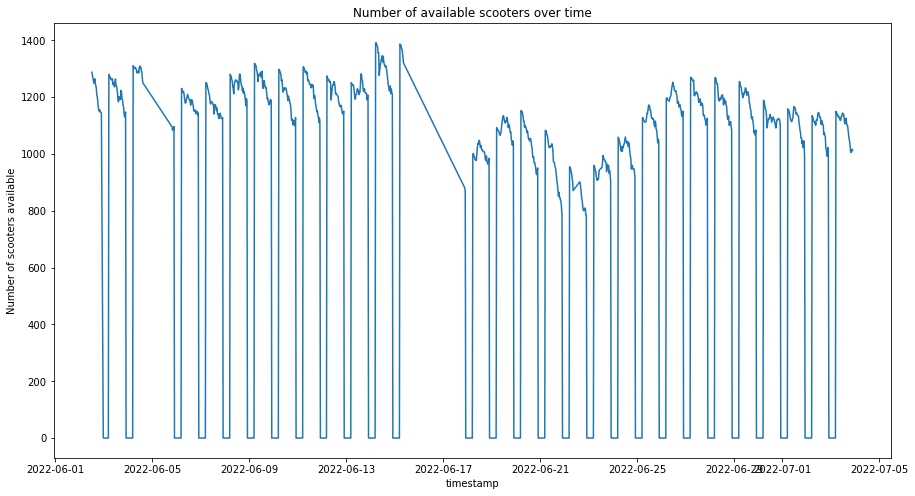
Plotting the data
I now plot the graph. I stated how long, because I may not want to plot the entire graph, I also have a step variable so that the graph will not be too packed. There are 39356 data items to fit inside a graph, so not every point has to be considered
import matplotlib.pyplot as plt

def plot_vehicle_count_graph():
    timestamp_np_array = np.load('cached_data/timestamp_np_array.npy', allow_pickle=True)
    vehicle_count_np_array = np.load('cached_data/vehicle_count_np_array.npy', allow_pickle=True)

    fig, ax = plt.subplots(figsize=(15,8), subplot_kw={"title": "Number of available scooters over time",
                                                       "xlabel": "timestamp",
                                                       "ylabel": "Number of scooters available"})
    fig.patch.set_facecolor('white')
    starting_time = 0
    how_long = 39356
    step = 30
    ax.plot(timestamp_np_array[starting_time:starting_time+how_long:step],
            vehicle_count_np_array[starting_time:starting_time+how_long:step])
    plt.show()

plot_vehicle_count_graph()
Note that I put everything in a function, this is so that when I come back to the project, and I need to run previous code blocks to import everything I need, I can do that without doing everything. I could've also separated all the imports and put them at the start of the Jupyter notebook.
Placing data in dataframe
I decided that it is important to have the data in tabular form, because when I investigate battery consumption, having data in tabular form makes it easier to track individual scooters. As it is just going down a column, compared to digging through multiple files.
I precompute everything and put it inside a dataframe, instead of going through the files every time I do the analysis for the scooters.
In that case, I will need to know how many columns and rows there will be, as in the pandas' documentation when I create a dataframe, I need to specify the columns and index.
Generating all vehicles set
We iterate through all the files, then we use list comprehension to accumulate all the ids, and we use the union operation to combine the set with the total set.
vehicle_id_set = set()

def all_vehicle_id_for_a_single_json_file(path):
    global vehicle_id_set
    try:
        with open(path, 'r') as f:
            json_data = json.load(f)
        for time_data in json_data:
            new_set = set([vehicle_data[0] for vehicle_data in time_data['vehicle_data']])
            vehicle_id_set = vehicle_id_set.union(new_set)
    except:
        traceback.print_exc()
        print(f"In all_vehicle_id_for_a_single_json_file: file {path.name} is not valid json")

def add_all_vehicle_id_to_set():
    global vehicle_id_set

    # Iterate through all files
    sorted_json_list = get_sorted_json_list()
    for json_path in sorted_json_list:
        all_vehicle_id_for_a_single_json_file(json_path)

add_all_vehicle_id_to_set()
Generating all timestamp list
Now I find out all the timestamps to use them as indexs.
datetime_np_array = np.empty(shape=(39356,), dtype=pd.Timestamp)
datetime_np_array_counter = 0

def get_all_dates():
    global datetime_np_array_counter
    sorted_json_list = get_sorted_json_list()
    for json_path in sorted_json_list:
        try:
            with open(json_path, 'r') as f:
                json_data = json.load(f)
            for time_data in json_data:
                datetime_np_array[datetime_np_array_counter] = pd.to_datetime(time_data['time_stamp'])
                datetime_np_array_counter += 1
        except:
            traceback.print_exc()
            print(f"In get_all_dates: file {json_path.name} is not valid json")
actually creating the dataframe
Now I create a dataframe with all the vehicle_id as columns, and the number of collected data as rows, this will be a huge dataframe. This is rather straightforward, I just call their constructor with the index, columns and data type specified.
battery_level_df = pd.DataFrame(index=datetime_np_array, columns=vehicle_id_set, dtype=np.int64)
longitude_df = pd.DataFrame(index=datetime_np_array, columns=vehicle_id_set, dtype=np.float64)
latitude_df = pd.DataFrame(index=datetime_np_array, columns=vehicle_id_set, dtype=np.float64)
filling the dataframe
Now that I have this empty dataframe, I need to fill it, I will once again iterate through the json_files, and put the correct data in the correct place when filling in the fields, I can either 1 .assume the order of data is correct and just fill them in one row by row without checking the index
- check the index every time, which is more expensive I think I will check the index, just to be safe
%%time

def fill_all_df(battery_level_df, longitude_df, latitude_df):
    for json_path in get_sorted_json_list():
        print(f"doing {json_path.name}")
        with open(json_path, 'r') as f:
            json_data = json.load(f)
        for time_data in json_data:
            current_row_datetime = pd.to_datetime(time_data['time_stamp'])
            for vehicle_data in time_data['vehicle_data']:
                battery_level_df.loc[current_row_datetime, vehicle_data[0]] = vehicle_data[1]
                longitude_df.loc[current_row_datetime, vehicle_data[0]] = vehicle_data[2]
                latitude_df.loc[current_row_datetime, vehicle_data[0]] = vehicle_data[3]

fill_all_df(battery_level_df, longitude_df, latitude_df)
I used the %%time to measure how long this operation took, and the result was Wall time: 1h 35min 49s, this proofs that this operation uses a lot of computing resources.
storing the data
Now I wish to store the result of the computation, I want it to store quickly, and load quickly, according to this article from Matthew Rocklin, the cost of serializing text-based data and numeric data is compared, and HDFS store seems to perform well in numeric data, so I decided to use it.
store = pd.HDFStore("store.h5")
store['battery_level_df'] = battery_level_df
store['longitude_df'] = longitude_df
store['latitude_df'] = latitude_df
What's next
I intended to talk about the results of my data analysis in this blog post, but this is already very long, so in the next one, I will use the dataframes to investigate why the number of scooters decreases throughout the day, and other interesting things.
![Focuster review: My experience as a student in summer [week 3]](/_next/image?url=https%3A%2F%2Fcdn.hashnode.com%2Fres%2Fhashnode%2Fimage%2Fupload%2Fv1693222238382%2F06452c01-14a3-423a-9311-83b9d82f6fcc.png&w=3840&q=75)
![Reclaim.AI review: My experience as a student in internship [week 2]](/_next/image?url=https%3A%2F%2Fcdn.hashnode.com%2Fres%2Fhashnode%2Fimage%2Fupload%2Fv1692385558997%2F5cd2253e-b50d-4d47-9aad-72807848b1a9.png&w=3840&q=75)
![Motion Review: My experience as a student in internship [week 1]](/_next/image?url=https%3A%2F%2Fcdn.hashnode.com%2Fres%2Fhashnode%2Fimage%2Fupload%2Fv1690840123756%2F5bdf844a-d728-430c-8d9b-b88b7b77c726.png&w=3840&q=75)
![Trialling Productivity Tools to Rescue My Time [Week 0]](/_next/image?url=https%3A%2F%2Fcdn.hashnode.com%2Fres%2Fhashnode%2Fimage%2Fupload%2Fv1690321356599%2F2f404dbe-3c2a-421b-903c-04d72c8febed.png&w=3840&q=75)