Where's my Voi scooter: [9] Masking scooter heatmap on the map using Python PIL module
![Where's my Voi scooter: [9] Masking scooter heatmap on the map using Python PIL module](/_next/image?url=https%3A%2F%2Fcdn.hashnode.com%2Fres%2Fhashnode%2Fimage%2Fupload%2Fv1659563934511%2F0GZxnmXkI.png&w=3840&q=75)
In this blog, I plan to incorporate the map into the heatmap made in the previous blog post, because, with only the heatmap, you can see which coordinates have a lot of scooters, but you have to reference the map with the coordinates, which is inconvenient. So I want to put the information on the Heatmap directly on the map so that the information is shown clearly.
Heatmap
Overlapping image
To overlap the image of the map and the heatmap, I need to find out how to have a half-transparent image on top of another image.
I first have to make an image transparent, I do that by using the putalpha(128) to make an image half transparent. It works by putting an alpha, or transparency level of 128 on that image. An alpha level of 0 means completely transparent, and level 255 means completely opaque. So 128 is in the middle, hence half-transparent.
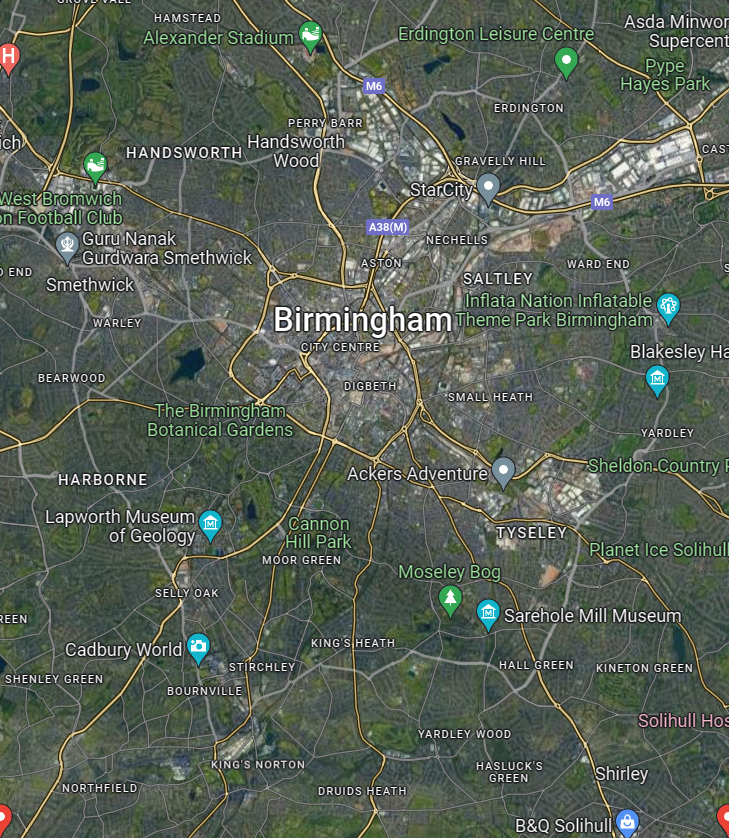
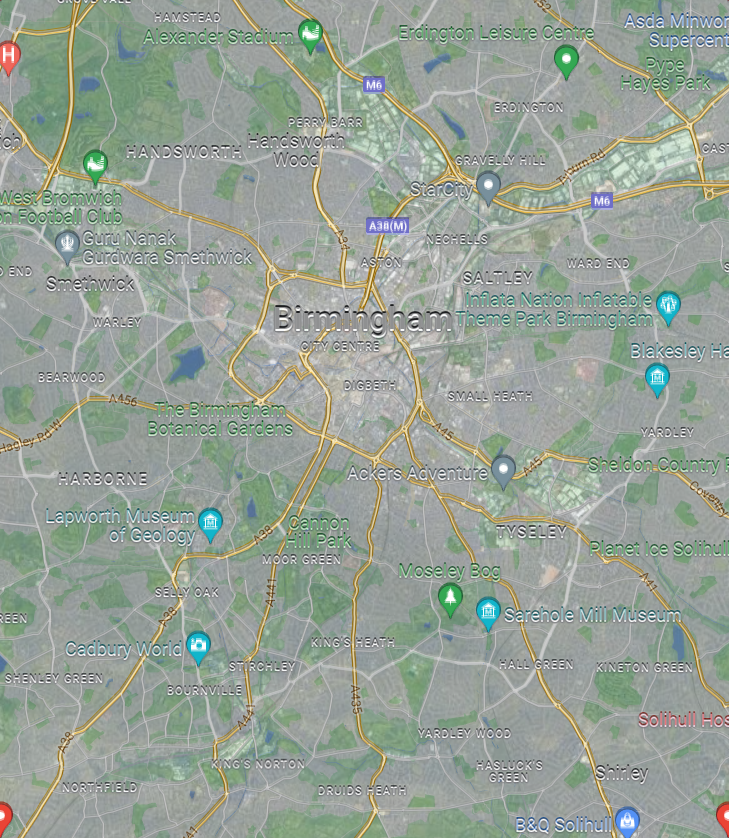
Then I tried using image.paste(another_image) to put the half-transparent image on top of the other. but what happened is the image complete overwrites the other. what I needed was alpha_composite. For testing, I alpha composited the half-transparent map on top of the sat.
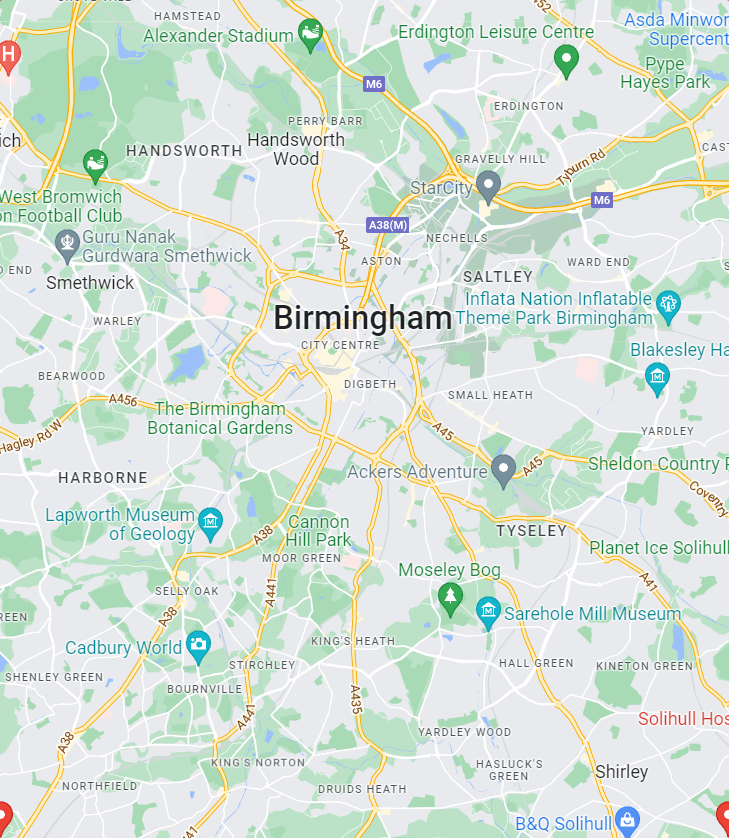
I created this map_img by getting the four coordinates I used for the range of the heatmap. and Taking a screenshot with exactly the four corners.
sat_map
from PIL import Image
map_img = Image.open('img/map.png')
map_img.putalpha(128)
sat_map = Image.open('img/sat_map.png')
sat_map.alpha_composite(map_img)
sat_map.save('img/result.png')
result.png
Masking
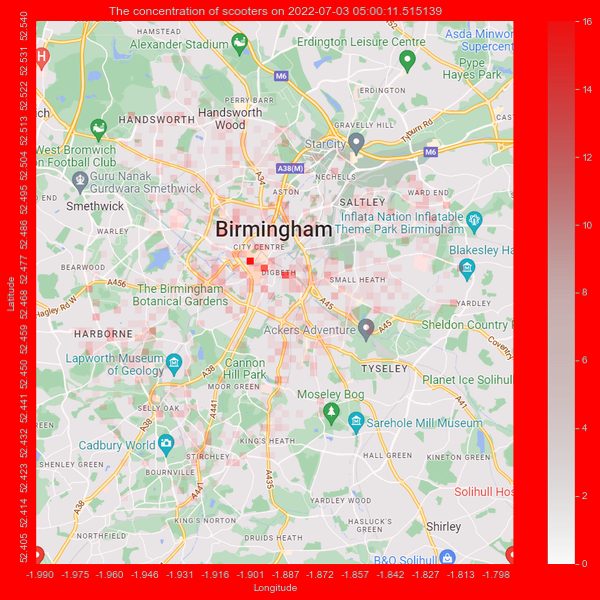
Now I want to mask the heatmap image on the map image so that we can see the areas with a lot of scooters on the map. I wanted to use alpha composite like the last example, but I figured that using masking would be better. Image masking is putting image A on image B using image C as a guideline. I plan to put a dark image over the map, using the heatmap as a guideline. Places with more scooters will be darker so that we can tell where the scooters are on the map.
The function to do the masking is Image.composite(), it requires all images to have the same size. So I plan to use the size width 600 height 600 for all. I first make a background image of all white, resize the map image to the size of the heatmap using the thumbnail function, and paste it into the background. then I read the heatmap image and fix its size and convert it to L, which means greyscale for some reason. then I make a red image of all red, and I composite all of them together.
bg_img = Image.new("RGBA", (600, 600), 0)
map_img = Image.open('img/map.png')
map_img.thumbnail((474, 546), Image.ANTIALIAS)
bg_img.paste(map_img, (36, 21))
heatmap_img = Image.open('img/heatmap.png').resize((600, 600)).convert("L")
bk_img = Image.new("RGB", (600, 600), 255).convert("RGBA")
final_img = Image.composite(bk_img, bg_img, heatmap_img)
final_img.save('img/result2.png')
heatmap_img
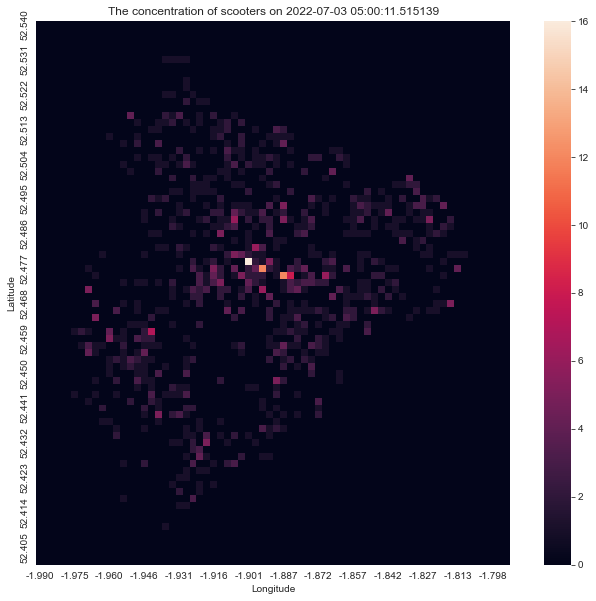
The result is, for the places with more scooters, a red overlay will be on them, so we can tell where the scooters are focused.
What's next
In the next blog, I plan to analyse the Voi scooter data from July, since my data collecting program has been running for over a month already. I'm sure there will be interesting data collected.
![Focuster review: My experience as a student in summer [week 3]](/_next/image?url=https%3A%2F%2Fcdn.hashnode.com%2Fres%2Fhashnode%2Fimage%2Fupload%2Fv1693222238382%2F06452c01-14a3-423a-9311-83b9d82f6fcc.png&w=3840&q=75)
![Reclaim.AI review: My experience as a student in internship [week 2]](/_next/image?url=https%3A%2F%2Fcdn.hashnode.com%2Fres%2Fhashnode%2Fimage%2Fupload%2Fv1692385558997%2F5cd2253e-b50d-4d47-9aad-72807848b1a9.png&w=3840&q=75)
![Motion Review: My experience as a student in internship [week 1]](/_next/image?url=https%3A%2F%2Fcdn.hashnode.com%2Fres%2Fhashnode%2Fimage%2Fupload%2Fv1690840123756%2F5bdf844a-d728-430c-8d9b-b88b7b77c726.png&w=3840&q=75)
![Trialling Productivity Tools to Rescue My Time [Week 0]](/_next/image?url=https%3A%2F%2Fcdn.hashnode.com%2Fres%2Fhashnode%2Fimage%2Fupload%2Fv1690321356599%2F2f404dbe-3c2a-421b-903c-04d72c8febed.png&w=3840&q=75)