Where's my Voi scooter: [5] Data processing and analysing vehicle count data
![Where's my Voi scooter: [5] Data processing and analysing vehicle count data](/_next/image?url=https%3A%2F%2Fcdn.hashnode.com%2Fres%2Fhashnode%2Fimage%2Fupload%2Fv1655481487026%2FIcYo1pdfD.jpg&w=3840&q=75)
With so much data collected, now is the time to dissect it and try to learn something from it.
Error during data collection
Before that, there were two instances of my program failing during the data collection stage that I want to record.
At night, with no available scooters, the JSON object returned by the Voi API has no scooter data. But my program still tries to iterate through all the scooters, therefore this caused an error and crashed the program causing some data loss. I had to modify the way I parse the JSON object to fix this.
The other one has to do with getting the access token. For some reason, one time the API didn't give me an access token when I asked for it, causing the program to crash because my program didn't expect this behaviour. After restarting the program, it functions normally again, therefore I concluded that this was an API side problem and not something I have to be aware of.
Analysing the data
To recap, the data I collected are:
- timestamp
- number of scooters available
- each scooter's code, battery level, and location in latitude and longitude.
How to learn to analyse the data
With the data I collected, I think I can analyse:
- The total number of scooters available over time: should be easy, just sketch a graph
- How fast does the battery run out: more difficult, I need to track individual scooters over a time frame
- where a specific scooter goes at different times
- try to predict where scooters appear
- classify scooters into different clusters
But I have not done anything like this, so I need to learn data analysis, sources I might use are:
- Udemy course about python machine learning, I guess I might use some python libraries later.
- searched on google how to data analysis, and one result is https://monkeylearn.com/blog/how-to-analyze-data/, talked about how to analyse data, and suggested some tools, however, because of how weirdly structured my data is, I doubt that it will work, but I will give google data studio a try, yep, it is not supported
- another result, https://www.datapine.com/blog/data-analysis-methods-and-techniques/, useful tips on common analysis techniques
Processing the data
I decided to just get started as I already have a basic idea of what I want to do, also I can always search online for things I don't understand. I created a new Python project, created a folder for those data, and downloaded the data from the VPS with a simple drag and drop.
Keeping the data secure, I then RARed it, then I found out that before RAR, it was 688 MB, but after RAR, it was 86 MB, apparently, I could have used a much simpler method of encoding the data.
Then I need to get the scooter count and timestamp. Since the data is grouped by hours in different files, I need to iterate through the files in ascending order of time.
For iterating through files, one way is to use their metadata: date created, to sort them, and the other way is to use their file name. Since the file name is created explicitly and follows a specific format scooter_data_2022-06-04T09.json, it is more reliable.
I used the glob function to get all the json files inside the folder location_data/, and then sorted them.
from pathlib import Path

path_list = sorted(Path('location_data/').glob('*.json'))
print(path_list)
With the sorted file list, I iterate through them to print their data.
def get_vehicle_count_list_from_file(path):
    with open(path, 'r') as f:
        try:
            json_data = json.load(f)
            for individual_data in json_data:
                print(individual_data['time_stamp'], individual_data['vehicle_count'])
        except ValueError:
            print(f"file {path.name} is not valid json")
This, however, didn't work. It turns out that every file is NOT a valid json. This is a big surprise because I formatted the files specifically so that they would all be valid JSON objects.
Invalid JSON error
I remember the famous Computer Science quote, "It worked on my machine", why does it not work now? the biggest difference between my machine and the server is my machine runs Windows, while the server runs Linux.
CRLF vs LF
Then I remember another issue I had with files, it is that Windows use CRLF, while Linux uses LF. CR stands for carriage return, and LF stands for line feed. When Windows ends a line, it ends it with \r\n, while Linux only uses \n. So when I seek -3 and truncate, there is different behaviour on Windows and Linux because of the number of line-ending characters. I tested it with the following code that writes abc then a new line, and print the result when I seek -3.
import os

with open('abc.txt', 'w') as f:
    f.write("abc\n")

with open('abc.txt', 'rb+') as f:
    f.seek(-3, os.SEEK_END)
    print(f.read())
On my Windows pc, the result is:
b'c\r\n'
But on my Ubuntu server
b'bc\n'
As you can see, the Windows version has a carriage return \r, but the Linux one does not. So this confirms the problem.
Dealing with the difference between CRLF and LF
There are several ways to deal with this problem
- when reading the file, act differently when we are on a different operating system
- convert the file after writing to it, replacing
'\r\n'with'\n' - this one I found on stack overflow, and is the most future proof. We use
newline='\n'as an argument inside theopenfunction when writing the file, therefore no matter the environment, the program will use LF to end a file.
To implement this fix, I need to update the program and restart it, therefore I decided that I will do it at night since there will be no data anyways, so I won't interrupt the data flow.
Fixing the incorrect data
But I also have to fix the current incorrect data, luckily, it would be easy since I'm just adding a } in the correct position. I fixed this by seeking to the correct place, writing} and then writing the remaining characters.
import json
import os

from file_handler import get_sorted_file_list

sorted_file_list = get_sorted_file_list()
for path in sorted_file_list:
    with open(path, 'rb+') as f:
        try:
            json_data = json.load(f)
        except ValueError:
            print(f"file {path.name} is not valid json")
            f.seek(-3, os.SEEK_END)
            remaining = f.read()
            f.seek(-3, os.SEEK_END)
            f.write('}'.encode())
            f.write(remaining)
            print(f.read())
Putting the data in a numpy array
I can now correctly print the time and vehicle count. I want to graph it, dealing with a large amount of data, I am thinking about using numpy to store and manipulate the data, then matplotlib to plot the graph as they are libraries specifically built for handling a large amount of data and are highly optimised.
To learn how to use them. There is a data analysis with python 4 hours course from FreeCodeCamp 2 years ago, and 10 hours one year ago. The question is, do I get started first and then watch the video later, or do I watch the video and then do my project.
It depends on whether it will take me 4 hours to figure out how to use the two libraries, which I doubt, so I will attempt it first.
Using my limited knowledge, I plan to store the result in a numpy array, and then store it as a file, which is called data preprocessing, so that I don't have to generate this data anymore.
My data is two-dimensional, the first dimension being the data item, but each data item also has the timestamp and vehicle count. I learned on stack overflow that pandas would be a better fit. So I switched to pandas, I tried adding items one by one in a pandas data frame, but there isn't a function like append() for normal arrays, it turns out that creating data frames are not easy, so I decided to store them in a separate np array first then add them to a data frame.
I also tried to treat a numpy array like a normal array, appending objects to an empty array, but it is not how it works as well, I am started to think maybe I should have watched that two video
What I did was that I created an empty numpy array, then appended to it each time.
np_array = np.empty()
for data_item in data_list:
    np_array = np.append(np_array, data_item)
This is very inefficient because we create a new numpy array each time we add a new item. I should create a big empty array first, then start to fill it up.
what I finally did was I created a MAX_SIZE variable for the maximum number of data, and then I iterate through the files, adding the data in the two numpy arrays, then I stored the data up to the counter, which counts the number of data items.
import json
import traceback
from pathlib import Path
import numpy as np
import pandas as pd

MAX_SIZE = 16800


def get_sorted_file_list():
    path_list = sorted(Path('location_data/').glob('*.json'))
    return path_list


def get_vehicle_count_list_from_file(path):
    global timestamp_np_array, vehicle_count_np_array, counter
    with open(path, 'r') as f:
        try:
            json_data = json.load(f)
            for individual_data in json_data:
                if counter < MAX_SIZE:
                    timestamp_np_array[counter] = pd.to_datetime(individual_data['time_stamp'])
                    vehicle_count_np_array[counter] = individual_data['vehicle_count']
                    counter += 1

        except ValueError:
            traceback.print_exc()
            print(f"file {path.name} is not valid json")


timestamp_np_array = np.empty(MAX_SIZE, dtype=pd.Timestamp)
vehicle_count_np_array = np.empty(MAX_SIZE, dtype=int)
counter = 0

for path in get_sorted_file_list():
    get_vehicle_count_list_from_file(path)

timestamp_np_array = timestamp_np_array[:counter]
vehicle_count_np_array = vehicle_count_np_array[:counter]

print(counter)

np.save('timestamp_np_array', timestamp_np_array)
np.save('vehicle_count_np_array', vehicle_count_np_array)
Creating the graphs
Having stored the data in files, I now plot the graph.
Overall graph
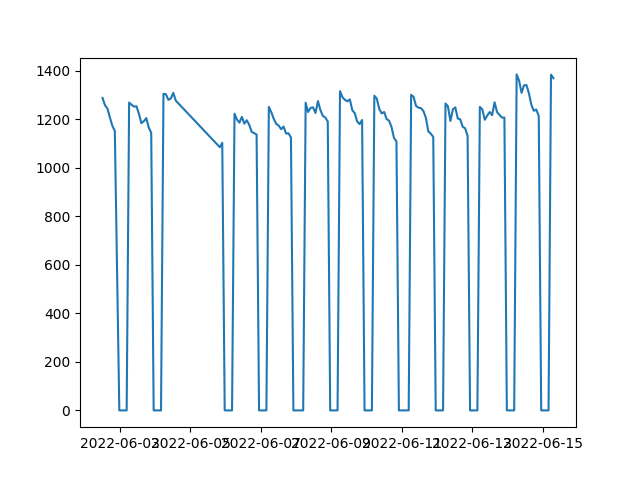 Note that there is some data loss, so the third and fourth day have merged, but it is because the program crashed between the two day, so there is no data between them.
import numpy as np
import matplotlib.pyplot as plt


timestamp_np_array = np.load('timestamp_np_array.npy', allow_pickle=True)
vehicle_count_np_array = np.load('vehicle_count_np_array.npy', allow_pickle=True)

fig, ax = plt.subplots()
ax.plot(timestamp_np_array[::100], vehicle_count_np_array[::100])
plt.show()
A single day (the fifth day)
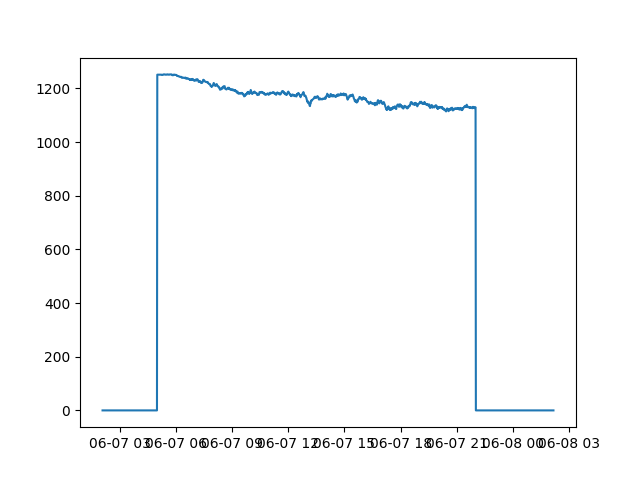
fig, ax = plt.subplots()
starting_time = 4800
how_long = 1440
step = 1
ax.plot(timestamp_np_array[starting_time:starting_time+how_long:step],
        vehicle_count_np_array[starting_time:starting_time+how_long:step])
plt.show()
Observations
- The number of available scooters is always over 1000, which means only a small amount of scooters are being utilized.
- There is a downwards trend for scooters every day, which is strange because I predicted it to plunge during rush hours when people go to and leave work. But it is a steady descent. One explanation would be battery, scooters are running out of battery throughout the day, so fewer and fewer are available. I will test this hypothesis afterwards.
What next
I will continue analysing the data in my next blog.
![Focuster review: My experience as a student in summer [week 3]](/_next/image?url=https%3A%2F%2Fcdn.hashnode.com%2Fres%2Fhashnode%2Fimage%2Fupload%2Fv1693222238382%2F06452c01-14a3-423a-9311-83b9d82f6fcc.png&w=3840&q=75)
![Reclaim.AI review: My experience as a student in internship [week 2]](/_next/image?url=https%3A%2F%2Fcdn.hashnode.com%2Fres%2Fhashnode%2Fimage%2Fupload%2Fv1692385558997%2F5cd2253e-b50d-4d47-9aad-72807848b1a9.png&w=3840&q=75)
![Motion Review: My experience as a student in internship [week 1]](/_next/image?url=https%3A%2F%2Fcdn.hashnode.com%2Fres%2Fhashnode%2Fimage%2Fupload%2Fv1690840123756%2F5bdf844a-d728-430c-8d9b-b88b7b77c726.png&w=3840&q=75)
![Trialling Productivity Tools to Rescue My Time [Week 0]](/_next/image?url=https%3A%2F%2Fcdn.hashnode.com%2Fres%2Fhashnode%2Fimage%2Fupload%2Fv1690321356599%2F2f404dbe-3c2a-421b-903c-04d72c8febed.png&w=3840&q=75)